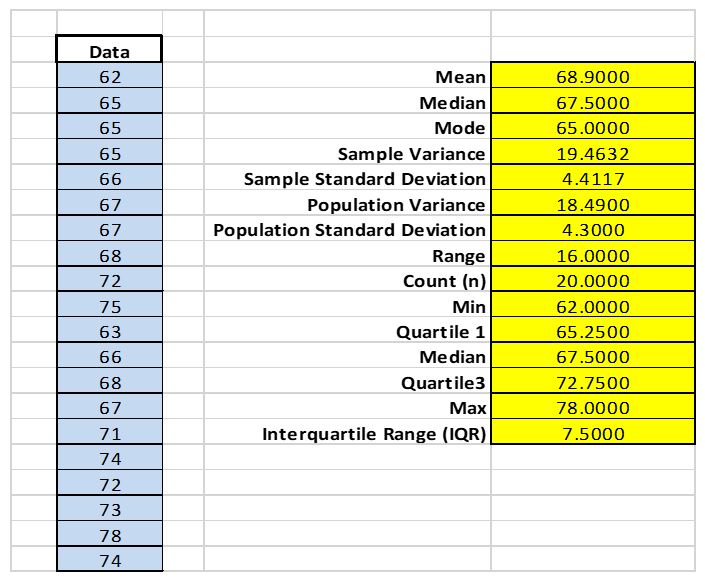
Figure 1 below shows the screenshot of the values obtained through excel. The mean height is 68.9 and the standard deviation is 4.41. Compared to the mean height of the results, I am taller since my height is 72.
Step 2
- The participants for the study were selected through sampling. Sampling is a statistical approach of choosing elements for study or a subgroup of the population from which statistical inferences can be made (Freedman, 2017). The sample also indicates the estimate features of the entire population under study.
There are various methods that can be applied for sampling. Researchers prefer different sampling methods because they do not need to study the whole population to gather actionable intuitions. Sampling is widely used as it saves time and is cost-effective. It also forms the base of any research design. In selecting the heights, I used the systematic sampling approach. Systematic sampling involves selecting the sample from a target population by choosing an arbitrary point to start from and then choose sample members after a fixed interval (Freedman, 2017). In this case, there were 100 students, so I picked every 10th student to form my sample. - Country of study
- The age of the population ranges from the age 20 to 25 years.
- The male elements constituted 60 percent of the sample while the female gender made up 40 percent of the sample.
Step 3
- The empirical rule is based on the bell-shaped normal probability curve. According to Freedman (2017), the empirical rule shows that nearly all observed data is expected to lie within three standard deviations (σ) of the mean (µ), as discussed below:
- Approximately 68 percent of the data will fall within 1 standard deviation of the mean. Alternatively, 68 percent of the data will fall between the mean subtract 1 x the standard deviation, and the mean added to 1 x the standard deviation. Statistically it is represented as: µ±1α
- About 95 percent of the data will fall within 2 standard deviation of the mean. Alternatively, 95 percent of the data will fall between the mean subtract 2 x the standard deviation, and the mean added to 2 x the standard deviation. Statistically it is represented as: µ±2α
- About 99.7 percent (or nearly all) of the data will fall within 2 standard deviation of the mean. Alternatively, 99.7 percent of the data will fall between the mean subtract 2 x the standard deviation, and the mean added to 2 x the standard deviation. Statistically it is represented as: µ±3α
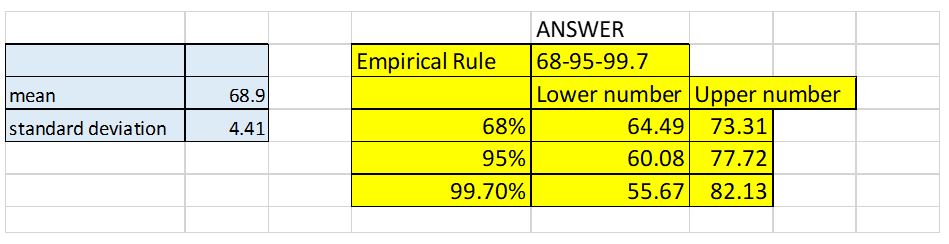
From the results in Figure 2 below:
- 68 percent represents the heights 64.49 to 73.31, it contains 68 percent of the data, and in this case it represents 15 data points apart 5;
- 95 percent represents the heights 60.08 to 77.72, it contains 95 percent of the data, and in this case it represents 19 data points apart 1; and
- 99.7 percent represents the heights 55.67 to 82.13, it contains 99.7 percent of the data, and in this case it represents all the data.
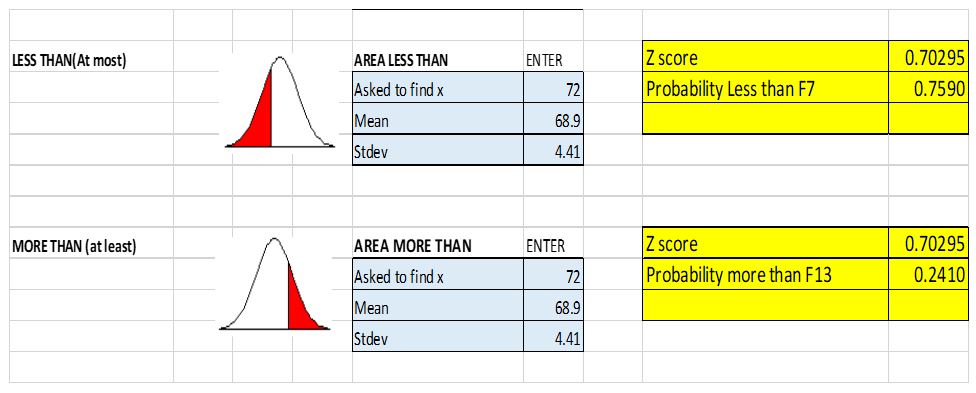
- My height is 72 inches, then 24.1 percent of the relevant population is shorter. The other 75.9 percent, is taller than me.
Reference
Freedman, D.H. (2017). Statistics. 4th ed. New York, W.W Norton & Company.