Research Background
The research study mainly focuses on training, performance, and labor productivity concepts and their effects on staff retention in the Qatar banking sector. The study’s relevance is that the banking industry plays an essential role in the Arab country’s economy. In 2023, Qatar banking is unstable, especially after the World Cup and the COVID-19 pandemic (Hajhamad et al., 2023).
Nevertheless, the long-term outlook for the sector is optimistic; there are already excellent opportunities for growth and development that need to be considered. The efficiency and effectiveness of banking institutions largely depend on employees’ qualifications and motivation. Employees are a critical resource whose retention is a source of advantage for any financial organization (Al-Suraihi et al., 2021). Moreover, retaining specialists is preferable to hiring new workers, both in terms of material benefits and innovative, creative approaches to work (Al Kurdi et al., 2020). Continuous quality employee training and increased worker engagement will contribute to talent retention, increase the competitiveness of the banking business in Qatar, and enhance several financial indicators.
Based on the above aspects, the student conducted an anonymous online survey among bank employees to find out their opinions about their place of work, specifics of job duties, occupational gratification, career ambitions, and plans in terms of profession. Data analysis is examining, interpreting, and presenting information to gain valuable insights and make informed decisions by banking organizations. It provides a fundamental framework for optimizing training and performance advancement efforts to improve retention and job satisfaction. A retention strategy needs to be constantly improved and supplemented. It should be part of a company’s corporate culture and not a band-aid used exclusively in cases of high staff turnover. By understanding people’s problems and needs, one can reduce turnover and retain valuable employees for the long term.
Questionnaire Explanation
The questionnaire was made using the Google Forms Likert Scale. Ease of use and the ability to obtain information in Excel for the most reasonable analysis are the scale’s leading advantages. The Google Forms interface is user-friendly for simple questionnaire creation, focusing on the study’s content and scope without spending additional time and effort learning complex software. It enables users to efficiently distribute the survey through email or links on social media or websites.
Google Forms allows one to customize different questions and provides various response options, including a Likert scale for detailed and accurate participant responses. It automatically collects and analyzes responses, providing a detailed data summary to interpret the results effectively. It should be mentioned that the questionnaire was sent out to 40 people. 101 responses were received using the snowball technique due to the limited coverage of banking sector employees. This paper will analyze all answers to demographic questions and performance questions.
Presentation of Data
Data will be presented using pie charts based on visual clarity, ease of perception, and category comparisons. A pie chart is a way of representing data as a circle divided into sectors, each representing a category of data that is a fraction of the total. A simple picture can be made available for a broad audience to understand patterns and trends in the data because the slices are proportional and clearly visible (“Benefits of pie charts in business,” 2022).
Generally, pie charts are an effective way to visualize data, show the relationship of several parts as a whole, and compare values with each other. They can instantly display details about data proportionally divided into sectors. Due to them, readers can quickly and easily absorb meaningful information, especially when there is little time to analyze a voluminous data set. Finally, pie charts allow researchers to compare different categories of information and see which type makes up a larger or smaller proportion.
Graphical Presentation of Questions and Answers
Demographic Questions
The vast majority of banking professionals surveyed are young, educated women between the ages of 18 and 29 with a bachelor’s degree. In the Qatari banking industry, people tend to work full-time. Employees’ experience varies widely; both experienced and novice staff can be found in roughly equal numbers.
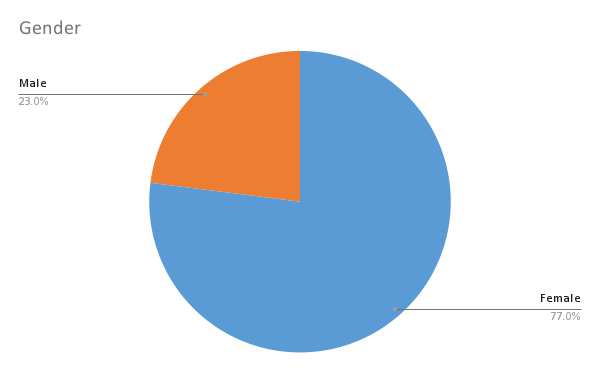
The first question in the section on demographics asked the employees to specify their gender. This question aimed at determining which gender group is the most representative among the Bank’s workers. The findings showed that females constitute the vast majority of the Bank’s employment force: 77%. Meanwhile, less than one-fourth, 23%, of employees is composed by male individuals.
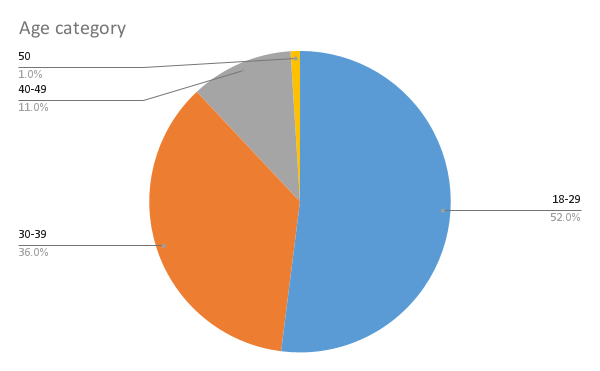
The purpose of this question was to locate the most and least prevailing age groups of the Bank’s employees. A little bit than half of all employees (52%) is composed of young individuals aged between 18 and 29 years. The next large group (36%) is composed of people aged 30-39, only 11% of employees are in their forties, and 1% is 50 years old. These findings indicate that the bank’s personnel is on average represented by young people.
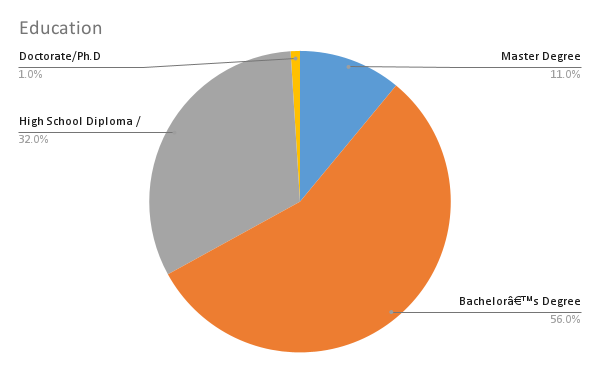
This question aimed to inquire about the employees’ educational background, which is a crucial factor in employment and career growth. The prevailing majority of respondents (56%) have a bachelor’s degree. About a tenth part of employees (11%) have a master’s degree, and 1% have a doctorate degree. Meanwhile, 32% of employees have a high school degree, which indicates that they might need additional education if they want to pursue a career in banking.
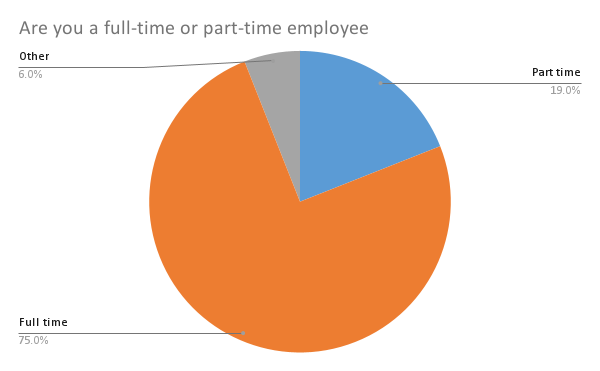
This question was developed to find out the type of employment preferred by the respondents. Exactly three-thirds of the employees reported being employed on a full-time basis. A smaller part of respondents (19%) works part-time. Meanwhile, 6% of employees said they had a different type of employment. These data indicate that the majority of the Bank’s employees are dedicated to their work in a Bank and consider it their first source of income.
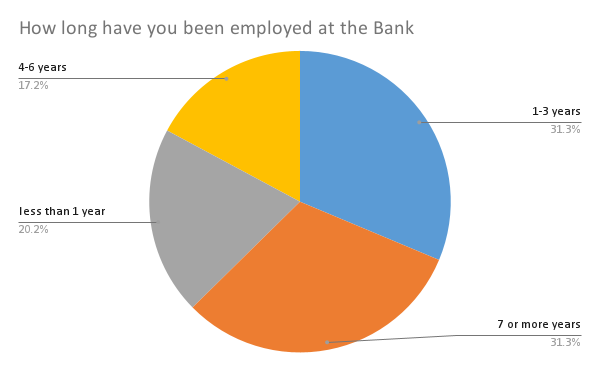
The final question in the demographics section concerns the number of years one has worked in the Bank. An equal percentage of people reported working for 1-3 years and seven or more years (31.3% in both cases). 20.2% of respondents have been employed at the Bank for less than a year, while 17.2% have worked for 4-6 years. These data indicate that retention strategies should be reviewed since there is a likelihood of people leaving after three years of work.
Retention Questions
Training Questions
Performance Questions
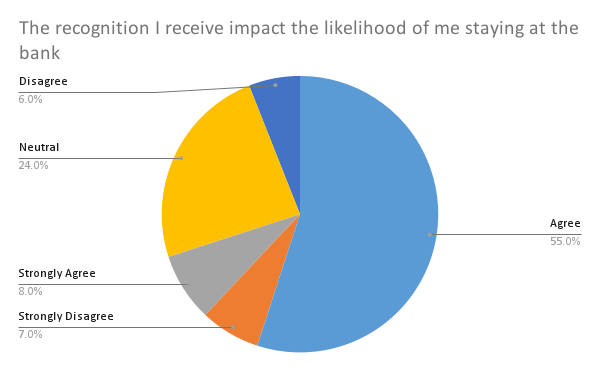
This question aimed to find out about the value employees attribute to recognition and their likelihood to stay at the Bank. The prevailing majority of employees (55%) agree that they feel more eager to work if their effort is being recognized. For 8%, recognition is extremely important. However, there are also many employees whose retention is not contingent on recognition (24% are neutral, 6% disagree, and 7% strongly disagree).
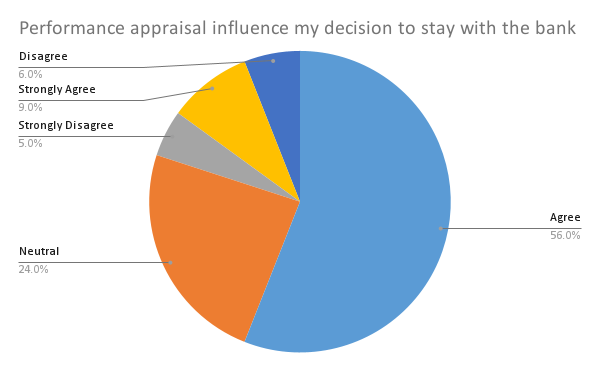
The responses to the question regarding the role of appraisal fall into almost the same categories as the question on recognition. The majority (56%) feel that performance appraisal affects their decision to stay with the Bank, and 9% feel very strongly about this. However, for the remaining employees, appraisal does not play an important role in retention (24% are neutral, 6% disagree, and 5% strongly disagree).
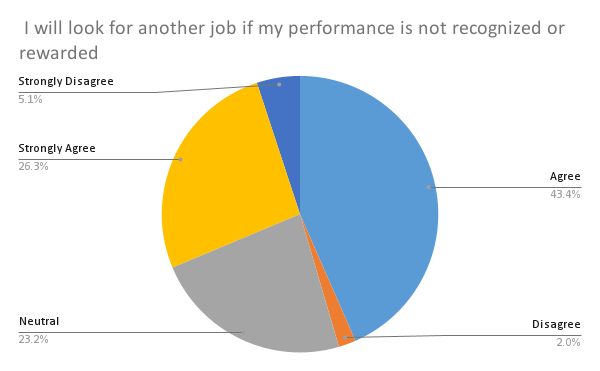
This question was aimed at establishing the connection between rewards and retention. A vast majority of respondents consider rewards a crucial element of retention (43.4% agree and 26.3% strongly agree). About one-fourth (23.2%) remained neutral, and 7.1% said they did not view rewards as something they cannot do without (2% disagreed and 5.1% strongly disagreed).
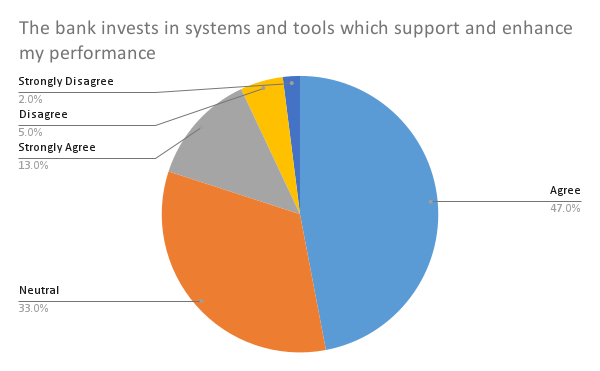
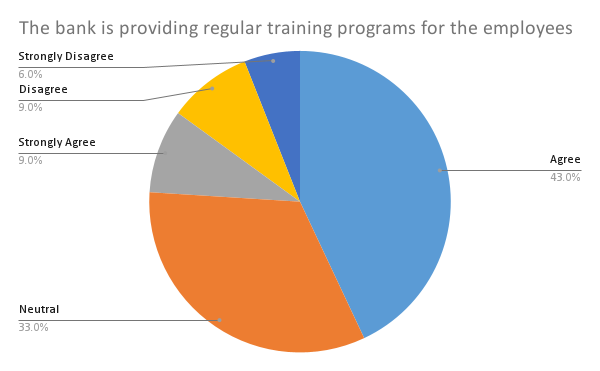
This question aimed to find out whether employees feel that the Bank promotes their performance through investing in systems and tools. Most of the employees agree with the statement (47% agree and 13% strongly agree), while 33% remain neutral, and the rest believe that there is no such investment.
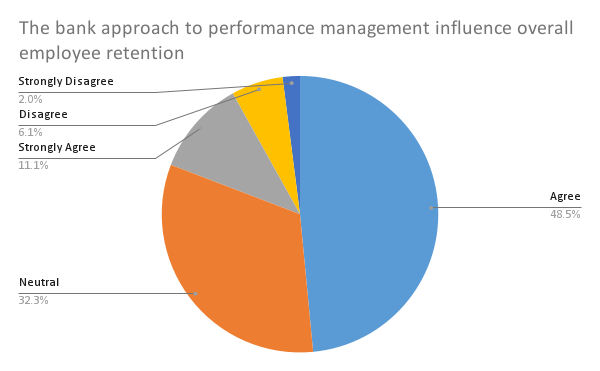
The final question relates to the Bank’s approach to performance management as a tool for retention improvement. More than half of respondents agree with this statement (48.5% agree and 11.1% strongly agree), while 32.3% feel neutral, and the minority disagrees (6.1% disagree and 2% strongly disagree).
References
Al Kurdi, B., Alshurideh, M., & Al Afaishat, T. (2020). Employee retention and organizational performance: Evidence from banking industry. Management Science Letters, 10, 3981–3990. Web.
Al-Suraihi, W. A., Samikon, S. A., Al-Suraihi, A. A., & Ibrahim, I. (2021). Employee turnover: Causes, importance and retention strategies. European Journal of Business and Management Research, 6(3), 1-10. Web.
Benefits of pie charts in business. (2022). Press Release Network. Web.
Hajhamad, B., Al Kiswani, A., & Lukin, D. (2023). Qatar banking sector report. PwC. Web.