Introduction
Investment in the UK is a challenge that needs to be viewed carefully by considering a number of important points such as the state of the economy, salary and wages, market segments, and trade fiscals. Having a business in the UK provides a good reputation and gives an entry into Europe and US markets. This research report provides an analysis of important areas that could impact investment decisions. Some points that are covered include the UK trade deficit, FDI inflow, goods and products traded, and the average salary and wages in the UK. The paper also provides a brief discussion on challenges faced by MNCs when they enter the UK and a set of recommendations is provided.
The report is written for the MD of ABC Ltd., a trading organization based in China. The company takes up import and export of manufactured goods to Africa, South America, and Asia. The company is thinking of investing in the UK and the report discusses important issues.
UK Trade
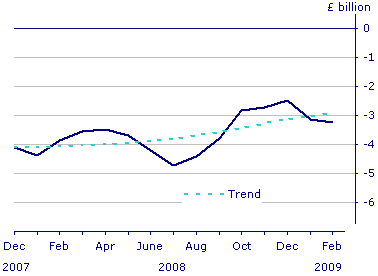
UK had a trade deficit of 3.2 billion GBP during February 2009 for goods and services and this figure is a rise over the 3.1 billion USD figure of January 2009. However, services had a surplus of 4.1 billion GBP while trade in goods had a deficit of 7.3 billion GBP. The figures suggest that the UK remains a net importer of trade goods and that there is sufficient scope for companies that want to set up trading and import of products (National Statistics, 9 April 2009). Please refer to the following figure that indicates the trade deficit.
The UK faces a credit crunch like many other countries in the world and this has been blamed on the economic recession. Cash crunch and credit crunches are a regular part of a business cycle and usually should not be the cause of too much worry as banks borrow money from the Bank of England or other banks and lend it to individuals, businesses, stockbrokers, and so on, who repay the loans as per the due dates. This is an accepted business practice and any shortage of funds is crossed over by short-term borrowings or by raising funds from the market in the form of equity, IPOs, mutual funds, hedge funds, and other instruments. The problem now has happened because there is no one from whom funds can be borrowed as banks have run out of funds and cannot extend credit to individuals and businesses. To add to the woes, because of economic recession and since a number of banks have failed in the US, there is no more liquidity left in the market and people have lost their jobs and cannot repay their loans. Since the world’s economy is based on the US dollar and the US forms the major trading partners for many countries, a recession in the US has hit the GDP of many countries, including the UK. The following figure gives the GDP of the UK since 2003 (Euromonitor, 15 December 2008).
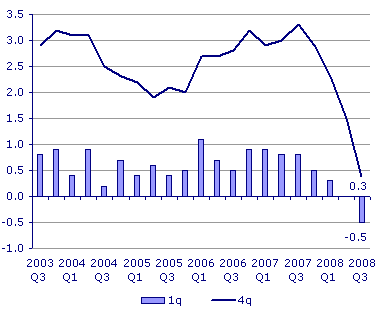
As seen in the above figure, UK GDP has seen crests and troughs since Q3 2003. In Q3 2007, the GBP peaked and then has seen a constant downward growth and the trend has become negative in Q3 2008 and this negative trend is expected to slip further. The credit crunch has resulted in a number of problems for the UK market and some of them are: Household debts in November 2008 have increased by 150% of the disposable income and servicing debts is a big problem. The fiscal position of the UK has seen a huge budget deficit of 23.3 billion GBP between April 2008 to October 2008. Taxes have to be increased to yield 4 billion GBP and this will impose an additional burden. To infuse some amount of credit, the Bank of England reduced the interest rate to 2% from 4% in December 2008 in the hope that the economy would grow but investments have reduced. Unemployment has jumped to 5.7%. Many banks have failed and have been nationalized and the government has spent about 87 billion GBP to support the failed banks. The Chartered Institute of Purchasing and Supply/Market construction index for October to November 2008, reduced from 35.1 to 31.8 this is the fastest contraction since records began in 1997. With no funds available, people default on loans, there is lesser demand for housing, and rates have fallen (Euromonitor, 15 December 2008).
FDI Inflow
Among all the European nations, UK had the maximum amount of FDI, and a 2008 year-end, there were reported FDI inflows of 1.43 trillion USD. The total stock of UK FDI stood at 1.347 trillion USD, According to media reports, UK is the most favored destination for FDI, and the trillion dollars FDI was repeated over the 2007 figures. It is expected that with the current economic recession and downturn, FDI inflows till 2010 would be reduced but the general trend is to watch and wait for the economy to spring back. The recent problem of the credit crunch has also forced trade organizations to revise their estimates and it is expected that there would be a 10% reduction in the forecast figures. However, when compared to the other countries in the EU zone, UK has fared much better because of its strong governance (Hopkins, 2008).
Please refer to Appendix “Table A.1 Top 25 Import Country Origins” gives the top trading partner countries for UK for imports and exports. As seen in the table, the top Import/ FDI inflows are from Germany, US, China, Netherlands and France an the total Exports/ FDI inflows are about 10.42 trillion GBP as of January 2009. Following table shows the details of export/ FDI for the top 25 countries. Please refer to Appendix “Table A.2 Top 25 Export Country Origins“. The top export destinations for UK are US, Germany, Netherlands, France and the Irish Republic. These countries saw exports of 7.15 trillion GBP.
Hence it can be seen that there is a lot of potential for a trading house to take up import and export activities in UK.
Goods Traded
UK has a very sizeable range of goods that are traded for import and export.
Goods for Export
As seen in Appendix A3. “Table A.3. Top 20 Export Products from UK“, the top 20 goods that are exported from UK are listed. Given in the table are the ranking for the products, value of exports in January 2009, percentage change for 2009 over 2008 and the % share for 2009 on year to date basis. The top exports are nuclear reactors and related items and these are highly restricted items that cannot be exported easily and hence these are not considered. The next items are mineral fuels, Pharmaceutical products, electrical goods and other items and these are also not considered as suitable for XYZ company since the % change for 2009 over 2008 shows a reduction in volumes. There are also many other products but such as vehicles and other products and these require special knowledge, clearances and handling techniques and hence not suitable for ABC Ltd. However, the products that ABC Ltd. can export from UK are inorganic chemicals and articles of apparel, given in bold in the table and ranked 14 and 19 respectively. The volumes of inorganic chemicals are 231 million GBP and that for apparel are 159 million GBP and these can be considered for exports. These items also show a rise in the change for 2009 over 2008.
Goods for Import
As seen in Appendix A4. “Table A.4. Top 20 Imported Products from UK“, the top 20 goods that are imported into UK are listed. Given in the table are the ranking for the products, value of imports in January 2009, percentage change for 2009 over 2008 and the % share for 2009 on year to date basis. The top imports are nuclear reactors and related items and these are highly restricted items that cannot be imported easily and hence these are not considered. The next items are mineral fuels and other items and these are also not considered as suitable for ABC Ltd. since the % change for 2009 over 2008 shows a reduction in volumes. However, the products that ABC Ltd. can export from UK are Articles of apparel ranked 11 and 12; Footwear ranked 17 and toys and games ranked 20. These products have good import values and there is an increasing trend for year 2009 over year 2008.
Labour Market and Average Wages
In the current economic recession, there have been widespread job losses and lay offs with thousands of business closing down. As of February 2009, there were about 1.39 million people who had lost their jobs. It is further reported that the rate of jobless is the highest since 1974 and the trend is expected to continue through 2009. The number of business currently active in UK is hard to estimate given the large varieties of businesses. However, number of trading organizations involved in the same work as that of ABC Ltd. are around 50 thousand. Following figure gives the gross median weekly earnings growth for men and women (nomis, January 2009).
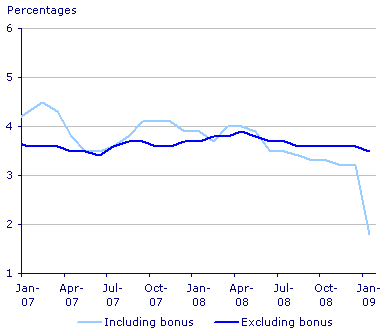
It must be understood that earnings vary as per the city and the nature of work, qualifications of the worker and the organization. However, the full time employees with top earnings earned about 946 GBP weekly while the lowest strata earned about 262 GBP weekly. In London, the top level earnings were about 613 GBP while in North East Ireland, the top wages were 418 GBP per week. It is also estimated that people in sales organizations, similar to ABC Ltd. earned a lowest wage of 272 GBP per week. Thus, it can be expected that ABC Ltd. that is a trading organization can expect to pay on an average of 250 GBP per week for its employees (nomis, January 2009).
Potential challenges which could arise when MNCs enter UK
Laidlaw (17 March 2009) comments that due to high labour costs and infrastructure costs, UK is depending more and more on imports and outsourcing is the norm. In this scenario, there is a high resistance from people who have lost jobs and from business that have been shut down. However, UK still needs products of appropriate quality that are economical and companies with sufficient resources can take up this challenge. Infrastructure costs are high and credit is tight so expecting funding from UK banks is difficult. Therefore, investors would have to rely on their internal funds and external borrowings. So the challenges are: credit crunch, economic recession, lower rates, lower demands, and a market with high entry barriers.
Recommendations
Some important recommendations are:
- ABC Ltd. can consider starting an import/ export house for trading goods. The cost of setting up such a business is less.
- ABC Ltd. can import items such as apparel, toys and games and export inorganic chemicals and some selected apparel items. There is a constant growth in demand for these items and there is sufficient volume.
- ABC Ltd. can source goods from China and other low cost labour countries and consider a tie up with local distributors for the retail market.
- There is a substantial inflow of FDIs in UK and the government provides incentives for foreign companies that wish to invest in UK.
References
Euromonitor, 2008. UK economy to perform the worst in Western Europe in 2009. Euromonitor International Publications, London, UK.
Hopkins. Kathryn. 2008, Britain is the first choice in Europe for foreign direct investment. Web.
Laidlaw. Sam, 2009. Adam Smith Institute– Overcoming Strategic Challenges for UK Utilities. Web.
National Statistics, 2009. UK Trade Deficit widened to £3.2 billion in February. Web.
nomis, 2009. National/Regional Headline Indicators for Nov 2008 – Jan 2009. Web.
UK Trade Info, 2009. UK Trade Imports Exports. Web.
Appendix
A1. Top 25 Import/ FDI country origins
Table A.1 Top 25 Import Country Origins (UK Trade Info, 2009).
A2. Top 25 Import/ FDI Country Origins
Table A.2 Top 25 Export Country Origins (UK Trade Info, 2009).
A3. Top 20 Products Exported from UK
Table A.3. Top 20 Export Products from UK (UK Trade Info, 2009).
A4. Top 20 Products Imported into UK
Table A.3. Top 20 Imported Products into UK (UK Trade Info, 2009).