Introduction
ZXY is an investment company that is considering investment in 2 new products. The company specializes in food products meaning they may not have difficulty in movement. The proposed expansion requires $7 million in initial investment. The equipment to be invested in has an estimated life of ten years after which it should be disposed for $1 million. The organization needs an ROI of 12%.
Financial Analysis: Revenue
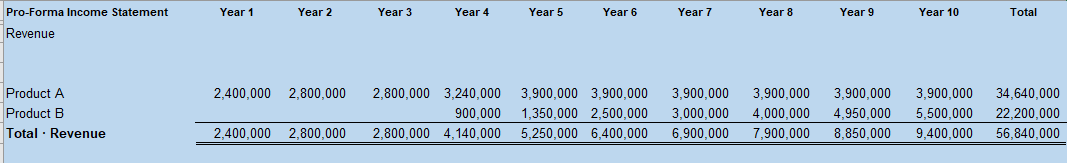
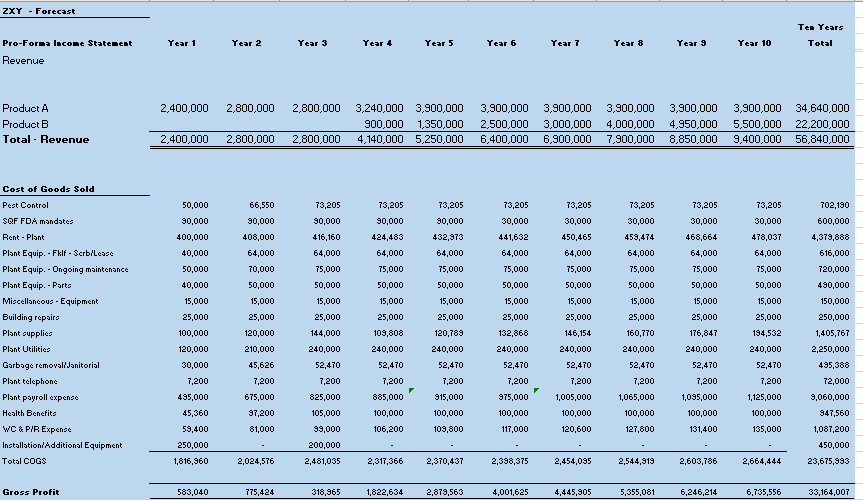
The above figure shows the projected revenue for both products over a period of ten years. In the first year, product A had a projected revenue of 2.4 million which increases to 2.8 million in the 2 subsequent years. Product B starts providing revenue in year 4 at 0.9 million while A is at 3.24 million. From yea5 to year 10, A maintains at 3.9 million. Over 10 years, product A has yielded a total of 34.64 million while B has yielded a total of 22 million. The total for both products is 56.84 million. The projections show that product A is projected to start yielding revenue earlier than B and will eventually have bigger totals than B at the end of the 10 year period.
Financial Information: Expenses
- Cost of Goods Sold (COGS) : Total = $23,675,993
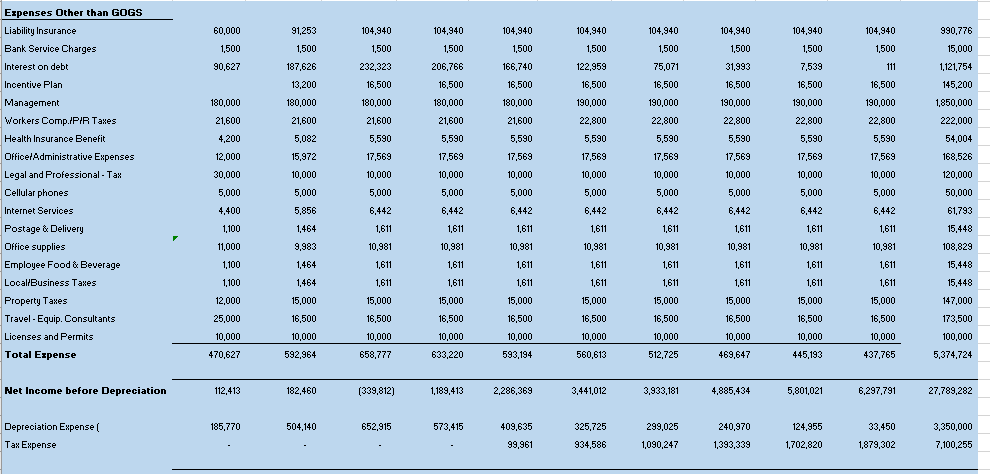
- Expenses other than COGS: Total = $5,374,724
- Expenses Total : $29,050,717
The above breakdown is for the total expenses. The cost of goods sold were 1.8 million on the first year, 2 million in the second year. 2.48 in the third and 2.31 in the fourth. In the fifth year, COGS total was 2.37 which increased to 2.4 million in the sixth year. In the seventh year, the COGS was 2.45 while in the eighth year t was 2.544 million. it was 2.6 million in the 9th year and 2.64 million in the final year. The total COGS totalled 23675993 million. On the row about expenses other than COGS, the first year total was 470627, 592 964 on the second year and 658777 in the third. In the fourth, the total was 633220 while in the fifth, the value was 593194 while the value was 560623 in the sixth year. In the seventh year, the value was 512725 and 469647 in the eighth year. Finally in the final two years, the values were 445193 and 437 765 respectively. The total yielded was 5.374 million. Combining this with COGS total yields 29 million dollars.
Risks Associated With the Project
From the financial statements, the project takes too long to recoup their initial investment. The projected was only able to make back the initial investment in the fourth year. The projections also indicate huge losses in the first three years with 73 357 dollars in the first year, 321 680 loss in the second year and 992 727 in the third year. These three years indicate that the company is likely to experience tumultuous times going forth with the investment; even if the tide does turn in the fourth quarter, it would be preferrable if the company kicked off with profits since the products are said to be staples.
Straight Line Depreciation
The investment cost is 7 million USD. The residual value is given as 1 million USD. After subtracting 1 million from 7 million, the depreciable value becomes 6 million. Dividing this depreciable by the useful value of 10 years yields 600000 per year.
MACRS Depreciation
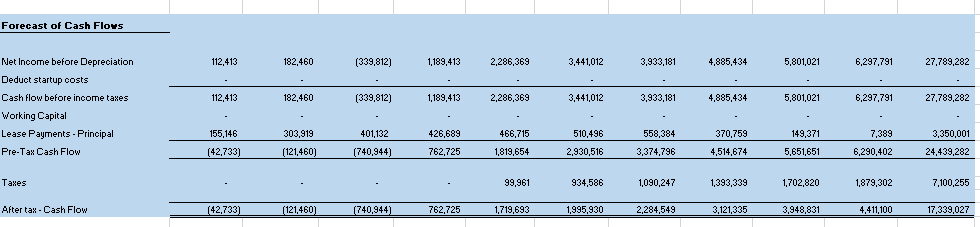
The above table shows the calculation of the NPV under MARCS. After the first year, the after tax cash flows were (42733) and the present value of cash flows was 38154. in the second year, the same variables were (121460) and (96 827). On the third year the values were still negative at (740944) and (527389). The fourth year yielded the first positive values at 762725 and 485725. The values stayed positive for the remainder of the period until the tenth year when they become 4411100 and 1420256. The present value of total cashflows becomes 6, 977, 667. After adding the residual value at end of year 10 by a rate of 0.32, it becomes 7, 2669, 641. Subtracting this value from the initial investment, the NPV is 269, 641.
Comparing MARCS with Straight Line
The annual depreciation under straight line method is higher than that from MARCS depreciation indicating that the tax liability would be lower for the company which the company could use to enhance their cash flow. The straight line depreciation method is a simplistic way of calculating depreciation where it is assumed to follow a linear path with the equipment falling by equal values each year. MARCS methodology, on the other hand, allows the capitalised cost of the asset to be redeemed over a particular period through annual deductions.
Recommendation for Investment
The initial investment of the project is 269641 dollars from the NPV calculation. The positive value is important for investors who are always looking for investments that generate profit over their useful lifetime. For this reason, the company should go ahead with the investment. All investments come with some risk. Even though the company takes time to earn some profit, it does well in the subsequent years which helps in the recovery. The straight line depreciation approach shows that the value is higher than the MARCS approach. This even further bolsters the recommendation for accepting the investment since the company would have less tax liability increasing their cashflow (Marshall et al., 2020).
Reasons for Recommendation
Net present value is the difference between current cash inflows and the current value cash outflow values over a certain period. NPV is applied in capital budgeting and in planning for investments to assess the projected profitability of the investment. NPV enables one to assess today’s value of future revenue streams. NPV allows comparisons of different alternatives. NPV takes into consideration the discount rate and could be obtained from the value of capita required to invest. Negative NPV values typically void a project (Marshall et al., 2020). In this example, the NPV was positive which is why ZXY should make the investment.
Reason For Recommendation: Cash flow
Cash flow means the flow of money in and out of business. Cashflow is important because it indicates that the company is engaging in business operations such as paying taxes, investing, paying employees and meeting operating costs (Marshall et al., 2020). When a company has positive cash flow, it shows that its liquid assets are increasing. Positive cash flow enables a business to settle debts, plough back, pay dividends to shareholders, meet expenses and buffer itself against future challenges (Marshall et al., 2020). On the other hand, negative cash flow shows that the liquid assets of the company are on the decline which cannot be a good thing. In the case of ZXY cashflow was positive which is a good sign.
Reasons for Recommendation: Risks are Endemic in All Investments
From the financial projections, it is evident that the investment ZXY intends to undertake is not all rosy. There are some pitfalls such as the lack of cashflow in the first 3 years. However, it is common for companies to experience a low period before the business takes off as it attempts to carve its space in the market. This is but one among many types of risks that investors must contend with and should not deter the investment as long as the fundamental indicators, in this case NPV, suggests that the investment is promising.
Conclusion
The paper was about ZXY company that intends to expand its operations by investing in equipment for the manufacture of 2 new products. The expansion will cost 7 million dollars for an equipment that will last 10 years and have a residual value of 1 million. The company expects an ROI of 12%. From an analysis of the financial statement, the company does not have cash flow for the first 3 years. From MARCS depreciation, the company has an NPV of $269641 while the straight line depreciation value is higher. This means the company will pay lesser taxes which will leave it with more cash. The NPV value is positive which shows that the investment is viable.
References
Marshall, D. H., McManus, W. W., & Viele, D. F. (2020). Accounting: What the numbers mean (12th ed.). McGraw-Hill.
Appendix 1
Appendix 2
Appendix 3