Background
Wind tunnels are specialized tools used to control airflow around a solid body and determine its motion. The aerospace industry uses standardized wind tunnel designs to optimize the performance of aircraft, minimizing friction. These experiments investigated the design and operation of wind tunnel facilities and the formation of the boundary layer. In addition to the boundary conditions in the aerospace domain, the investigation can be used to determine the excellent design used for other applications, such as motor sports.
Theory
Lift and drag are fundamental aerodynamic forces that act on an airfoil and are determined by the angle of attack. It is imperative to note that the wind direction is directly proportional to the point and will likely affect its action. While the drag force acts horizontally, the lift force acts upwards and must be considered in the design parameter. The flow of a fluid is either turbulent or laminar, and is determined by the Reynolds number (Si-min et al., 2020). The fluid flow is determined by the fluid’s force, density, and viscosity, as given by the following equation.
![]()
When the fluid flow is regarded as laminar, it is less than. However, the fluid flow is considered turbulent when the Reynolds number exceeds 5 × 10^5. It is essential to note that when this occurs, it is regarded as the boundary (Si-min et al., 2020). Friction plays a crucial role in the calculation of fluid flow, and assuming that Cf gives the coefficient, the two boundary layers are given as:
and
![]()
and
![]()
When the two models are considered, and the coefficients remain unchanged, the equations for the lift and drag are as given in the equation below:
![]()
![]()
Apparatus
The schematic diagram shown below was used for the experiment. Figure 1 shows the schematic diagram, and Figure 2 illustrates the tests to be conducted. Figure 3 illustrates the data sheets and various features of the materials used. The different models exhibit three distinct shapes that respond differently to aerodynamic forces.
In addition to the schematic diagram and models, the other materials required for the experiment include an angle attack indicator, a subsonic wind tunnel, the airfoil model, and a force balance. The subsonic wind tunnel produces controlled airflow for a detailed analysis (Si-min et al., 2020). The angle-of-attack indicator determines the direction, while the pressure sensor measures pressure at different levels.
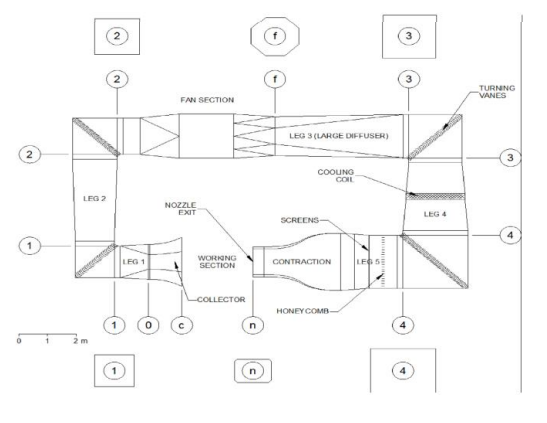
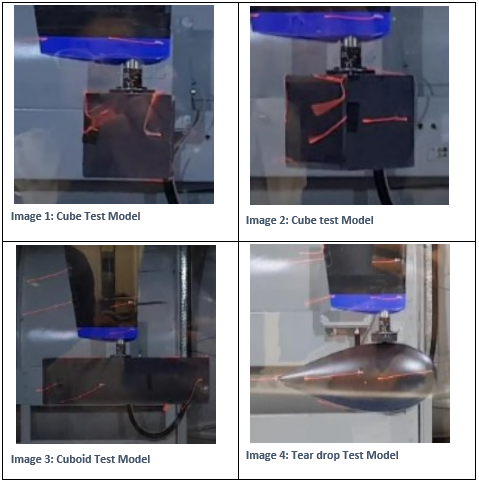
Figure 3 – Technical Data of the Materials
Experiment Procedure
The system functionality was guaranteed to ensure that all the ground board was located at the bottom end of the test section. Ensuring that the board and models were at rest was crucial to prevent wind interference around the model. Once the board was set at rest, the test models were attached to the overhung balance.
Before the test was started, the balance was set to zero to ensure no inaccuracies. The frontal area of each model was noted, and the air velocity was then set at intervals of 5 for the following numbers: 10, 15, 20, 25, 30, 35, 40, and 45 m/s. The aerodynamic force was measured at each of the set intervals.
Measurement and Results
Table 1 below presents the measurements at each speed and their impact on the characteristics.
Table 1 – Speed and Characteristics
From the recorded data, the Reynolds number is manually calculated to determine whether the flow is laminar or turbulent. Sample calculations are shown below:
![]()
![]()
![]()
The boundary flow can therefore be regarded as laminar because it is below the threshold of. Once the Reynolds number has been calculated, the boundary layer can be calculated from the given equation.


![]()
![]()
From the boundary condition determined, it can be calculated using the formulas below:

![]()
Nevertheless, it is given as double the value of. Therefore, it will be calculated as follows:
![]()
![]()
![]()
The drag and lift calculations can be done at each selected velocity. The calculation below is a sample at 10m/s.
![]()
![]()
![]()
![]()
![]()
![]()
Analysis
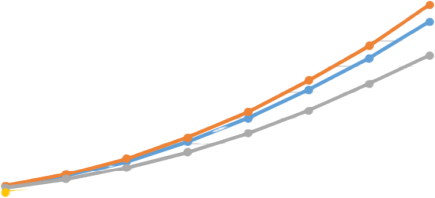
In Figure 4, all three models displayed similar characteristics and patterns. The graph shows that increasing V results in a significant increase in drag. The cuboid, however, exhibits the highest drag force, indicating that it is the least suitable shape for aerodynamic objects (Si-min et al., 2020).
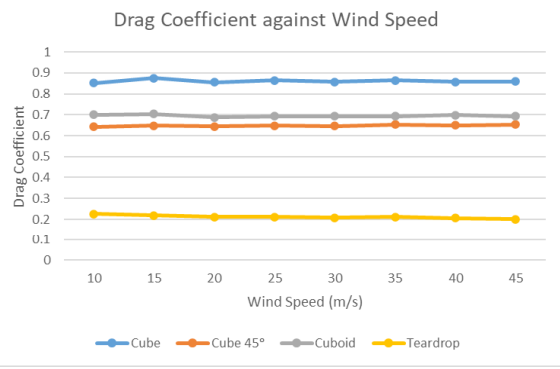
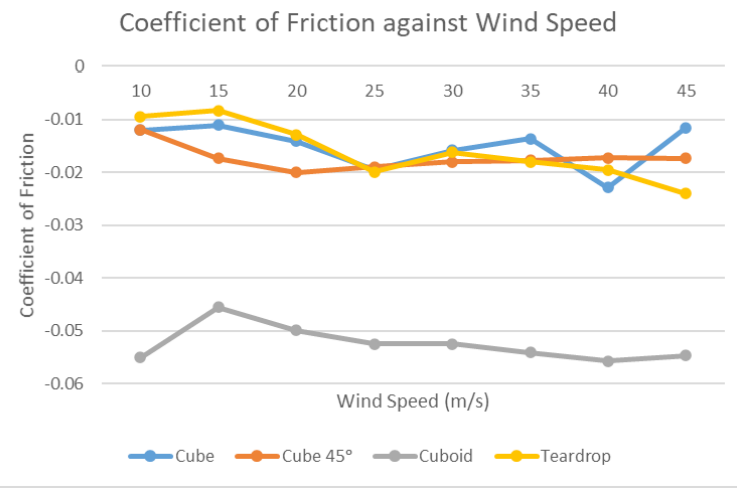
Furthermore, the experiment reveals that the teardrop shape has the lowest drag force, indicating that it should be considered for use in most aerospace design applications. Figure 6 illustrates a distinct property of the models and demonstrates what would happen if they were flying through the air. Figure 5 shows how wind speed affects the drag coefficient.
Potential Errors in the Experiment
The experimental setup was prone to numerous errors that could have affected the overall outcome. The most evident source of error was the strut holding the models, as galloping would cause additional force. The values induced by galloping would affect the overall force values. The number of measurements would be increased to reduce the errors. The increments of the wind speed can be used to reduce the errors.
Conclusion
The experiment successfully demonstrated that the shape of an object directly affects its aerodynamic properties. Different shapes produce different drag forces and affect how a general transport device is affected based on its shape. The teardrop proved to be the object that produced less force, constant friction, and pressure. Furthermore, an increase in wind speed produces the highest boundary layer, and the object’s shape needs to be adjusted to lower the force and turbulence for efficiency.
Reference
Si-min, Z. O. U., Xu-hui, H. E., Han-feng, W. A. N. G., Lin-bo, T. A. N. G., & Tian-wei, (2020). Wind tunnel experiment on aerodynamic characteristics of high-speed train-bridge system under crosswind. Journal of Traffic and Transportation Engineering, 20(1), 132-139.