Introduction
Bangles International Jewellery (BIJ) refers to a global jewellery firm located in Europe, North America, and Asia. BIJ has recently launched its marketing efforts in the United Kingdom. In addition, the company has hired the Wood From The Trees (WFTT) team to evaluate the impact of the marketing campaign on BIJ sales. The report’s purpose is to determine if BIJ’s marketing campaign positively impacted the company’s sales performance in the United Kingdom in May 2021. The report is divided into five parts: introduction and project plan, data quality issues and remedies, data analysis and commentary, data charting and commentary, and conclusions and recommendations. The report also explores data quality problems and solutions of the provided dataset, along with a summary of data visualization. To understand BIJ’s business operations and performance, it is critical to utilize an appropriate data analytics framework to evaluate data, visualize analysis findings, and provide recommendations.
The overall project plan will start identifying modern organizations’ data quality problems. The next step involves reviewing the provided dataset to detect any errors and, if present, attempt to fix them. Data analysis will be conducted using the provided dataset and visualized through three tables showing sales value and volume data across the Japanese, U.S., and United Kingdom markets from 2018 to 2020. Key data from the tables is summarised using two bullet points. The assignment proceeds to the next part, where data charting will be done using line and bar graphs that show sales value and volume trends across the Japanese, U.S., and United Kingdom markets for three years. Comparisons of sales performance by category and country will also be analysed. Finally, appropriate recommendations will be offered using the data analysis and charting information.
A data analytics framework helps data analysts to conduct data analysis in a systematic and ordered manner. Different analytic data frameworks exist, including prescriptive, predictive, diagnostic, and descriptive. In the report, a descriptive analytics framework is chosen as a model for analysis of the provided dataset because of the intended conclusions and supplied data from BIJ. Statistical techniques such as mode, mean, standard deviation, and median and graphical approaches such as box plots and histograms are used in descriptive analytics. Some of these strategies are utilized in the report to summarize and visualize information from the provided dataset to understand the implications of BIJ’s marketing campaign, including consumer behaviour, sales trends, and profitability (McEvoy, 2018, p. 42). The findings will be utilised to answer whether BIJ’s United Kingdom campaign positively influenced their sales outcomes.
The Key Performance Indicators (KPIs) for BIJ’s business used in the report are the variables of annual measure of sales value and sales volume of different goods supplied by the company in various nations, according to the data available. Sales volume differentiates how products sell in a year in one nation compared to other countries. In contrast, sales value offers a comparison of how much certain industrial items sell in one country compared to other nations. Comparing the sales value and volume of various products between the United Kingdom and other countries such as the U.S. and Japan will provide information to evaluate if the marketing campaign effectively increased United Kingdom’s sales.
Data Quality Issues and Remedies
Businesses increasingly rely on data to make evidence-based decisions affecting business value. While data has become increasingly massive, good data-driven decisions depend on whether the data is accurate. Therefore, businesses use massive data quantities and analyse through complex tools to filter unusable data and only utilise the relevant ones. Companies may struggle with data quality issues that can lead to faulty decision-making. Approximately forty percent of corporate data that organisations collect and gather is unavailable, missing, and erroneous (Liu, 2020). In addition, data quality problems cost the average firm about $14 million each year (Slack and Brandon-Jones, 2021, p. 23). Thus, thoroughly reviewing and cleaning up data before it is analysed is imperative. There are several challenges in data quality that firms may face, and their solutions as explained in the following:
Duplicate Data
Each organisation deals with duplicate data at a point in its existence. The challenge often occurs due to different systems and siloed processes that record the same data. When copies of the same record are many, they might significantly distort data analysis findings. In addition, duplicate data can waste efforts as many resources are used during information processing. Data duplication can be solved through a data verification method that utilises data deduplication tools to isolate duplicate data by identifying identical records. Data deduplication employs algorithms to comp through massive datasets for identical records (Gandhi, Bhatia and Dev, 2021, p. 52). Compared to the past systems, modern systems do not overlook slight discrepancies and can even detect minor differences in various entries for a client.
Incomplete Fields
The incomplete field hazard is often caused by data entries created manually. Filled or blank fields can hinder big data tools such as customer relationship management (CRM) software and automated marketing interventions. Incomplete fields can be avoided by using automated systems for data entry that automatically detect missing fields and initiate prompts to fill them in. The method is effective because it ensures records can only be generated if the user provides all necessary data (Liu, 2020, p. 321). In addition, it is critical to put mechanisms that discard partial inputs to avoid problems that incomplete fields bring.
Inconsistent Formats
Inconsistent formats in data that companies collect are a general issue that affects data quality and analysis. Most systems can fail to recognise items or datasets that belong to a similar category if the original data covers the same information but is stored using different forms, leading to erroneous results. For example, dates can be a problem since it is incredibly difficult to differentiate between European and U.S. style dates. For instance, if a data source utilises the DD/MM/YY format while another one uses MM/DD/YY format, the outcome might lead to inaccurate findings (Gandhi, Bhatia and Dev, 2021, p. 26). The problem can be eliminated by choosing a standard date format before data is entered into a system to promote consistency for each source utilised by an organisation.
Multiple Units and Languages
Differences in measurement units, language, or script can cause challenges in data quality. For example, failing to determine the difficulty of metric units in data analysis can result in catastrophic damage to data quality. Similarly, handling data stored using several languages can be problematic if the data analytic tools cannot interpret or detect it. Even unique characters such as umlauts and accents can lead to a problem if data analysis systems are not specifically made to process them (Liu, 2020, p. 316). Therefore, when people are working with global datasets, they need to anticipate such challenges and adjust their algorithms accordingly.
Data Issues in The BIJ Dataset
Several issues in the BIJ dataset might make it difficult to conduct an error-free data analysis. First, some of the sales values in the BIJ data were entered into the file in U.S. dollars, whereas others were provided in Sterling Pound. The issue is addressed by converting the values in U.S. dollars to Sterling Pound for different periods. Second, some categories had different names despite being of the same subtype. The biggest challenge in the data analysis investigating the impact of the marketing campaign by BIJ.
Data Analysis and Commentary
The data can be analysed by using tables and commenting on the information that can be seen from provided tables. Table A contains data extracted from the provided BIJ dataset for three years, including 2018, 2019, and 2021. It can help compare sales value and sales volume in the other months and years for the company. The following information can be seen in the table below:
- The sales value and volume data for 2020, 2019, and 2018 as well as those of every individual month for the three years.
- 2020 was the best-selling year in terms of value and volume.
Table A: Data and Trends in Sales Value and Volume by Year, Month, And Across the Whole Analysis Period
Table Summary
Table B evaluates category performance using sales value and volume data for various materials sold in the United Kingdom. The succeeding information can be extracted from the table, including:
- Sales value and volume data for five categories of materials sold in the United Kingdom for 2020, 2019, and 2018.
- Bracelet was the most sold product among the different BIJ offerings for three consecutive years.
Table B: Benchmark Comparisons of Category Performance That Cover Sales Value and Volume by Year, Quarter, And the Whole Analysis Period
The material with the most sales is the bracelet category, while accessory has the lowest sales among BIJ products. The quarter where BIJ recorded the most sales is Q3 2020.
Table C contains data on sales value and volume for BIJ in the Japan, U.S., and United Kingdom markets for three years. The data that can be derived from the table are:
- The sales value and volume data for the U.S., United Kingdom, and Japan markets for 2020, 2019, and 2018 as well as their relevant quarters.
- The Japanese market is the best performer in sales value and volume, whereas the United Kingdom has had the worst sales performance for three consecutive years.
Table C: Benchmarks comparisons of sales value and volume between markets by year, quarter, and across the whole analysis period
Table Summary
Based on the available dataset analysis, the United Kingdom marketing campaign did not positively impact sales performance. However, it averted a dramatic sales drop from January to December in the three years.
Data Charting and Commentary
Comparison of Sales Value Trends Across Markets
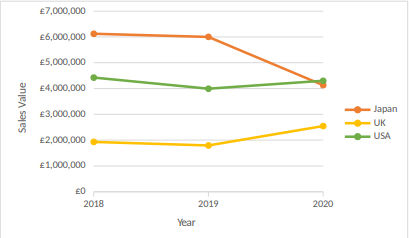
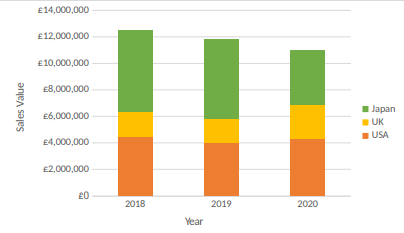
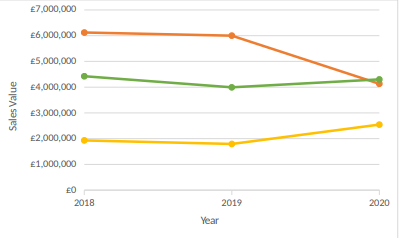
The two graphs show sales value trends across the Japan, U.S., and United Kingdom markets. Several primary points can be derived from the two graphs, including the following:
- Japan recorded the most value in sales in 2018 and 2019, whereas the U.S. has the most value in terms of sales in 2020.
- The United Kingdom, where the marketing campaign was conducted, recorded the worst sales value for three consecutive years compared to the U.S. and Japanese markets.
Comparison of Performance in Different Categories and Markets
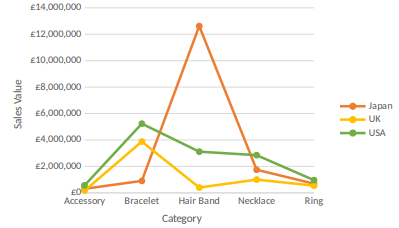
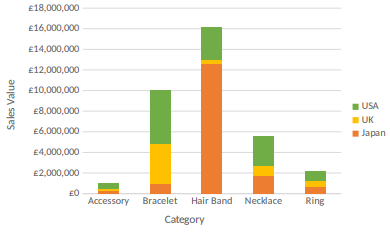
In this section, a bar and line graph are used to compare how different BIJ products perform across the Japanese, U.S., and United Kingdom markets. The two graphs show the following:
- During the three years, the U.S recorded the highest sales value in products such as rings, necklaces, bracelets, and accessories. In contrast, Japan had the most sales value in the hairband category.
- The target of the marketing campaign, the United Kingdom, had the lowest sales of hairbands, rings, necklaces, and accessories compared to the other markets. The bracelet category had higher sales in the United Kingdom than in Japan but lower compared to the U.S.
The Marketing Campaign Impact on the United Kingdom Market
The marketing campaign impact is evaluated based on the provided dataset from 2018 to 2020. The changes in the sales values over the three years were visualized in a line graph. The annual changes in sales in the United Kingdom market after 2018 were calculated and compared to other values in the U.S. and Japanese markets to comprehend the marketing campaign’s impact on the United Kingdom sales as the promotion was conducted in 2018.
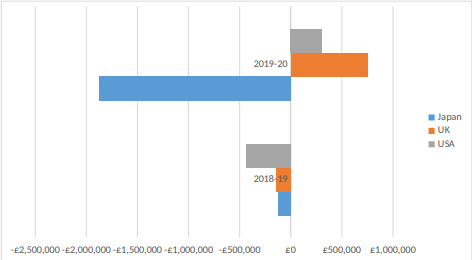
The bar graph depicts the changes in sales value between the 2019/2020 and 2018/2019 periods. From 2018 to 2019, the three markets experienced a drop in sales value, with the highest drop recorded in the U.S. market. The Japanese market had the lowest decline in sales value from 2018 to 2019. From 2019 to 2020, the United Kingdom recorded the highest sales value increase across the three markets, with the U.S. coming second. However, Japan experienced a dramatic decrease in sales value from 2018 to 2020.
Conclusions and Recommendations
In conclusion, embracing data-driven decisions for businesses such as BIJ is essential as it utilises a data analytics framework to visualize and evaluate data and improve processes. Based on the analysis of the provided dataset, BIJ recorded the highest sales in the Japanese market in 2018 and 2019, whereas in the U.S., the company recorded the highest sales in 2020. However, the United Kingdom had the lowest sales of the three markets from 2018 to 2020. Surprisingly, the United Kingdom market performed well regarding the differences in sales value. The United Kingdom has the lowest sales value changes and did not allow the massive decrease in sales values seen in the Japanese and U.S. markets. Since the United Kingdom marketing campaign was conducted in 2018, it is reasonable to conclude that it effectively reduced the sales value decrease in the region compared to the Japanese and U.S. markets.
The conclusions suggest that BIJ needs to increase its reliance on data-driven business decisions. There are various recommendations that BIJ can follow to improve its business processes. First, the company should continue focusing on increasing the reach of the United Kingdom campaign. In addition, the company should conduct similar campaigns in the U.S. and Japanese markets after investigating why sales are decreasing in those markets. Second, the company can focus on increasing the product’s marketing efforts with the highest sales and find the reasons for failing products (Slack and Brandon-Jones, 2021, p. 360). Conducting customer reviews can help BIJ understand consumer behaviour and improve all their product categories.
Reference List
Gandhi, P., Bhatia, S. and Dev, K. (eds.) (2021) Data driven decision making using analytics. Florida: CRC Press.
Liu, G. (2020) ‘Data quality problems troubling business and financial researchers: a literature review and synthetic analysis’, Journal of Business & Finance Librarianship, 25(3-4), pp.315-371.
McEvoy, D.M. (2018) A guide to business statistics. New Jersey: John Wiley & Sons.
Slack, N. and Brandon-Jones, A. (2021) Operations management. 9th edn. London: Pearson.