Introduction
Portfolio analysis is one of the most important strategy tools that multi-product or business unit companies employ to ascertain their product situation and take their decisions regarding the product’s future. One of the most widely used analysis tools is the BCG matrix. This article aims to understand the usefulness of the BCG matrix in a high-tech organization. The main purpose of the study is to find the BCG matrix of a service or a manufacturing company and then analyze it. So in the first part, we will first understand how the BCG matrix is found for a company. The organization understudy for this paper is Hewitt- Packard Company. We will draw the BCG matrix for HP, after studying the different product offerings the company has and then do a brief analysis of the matrix. The second part of the article will deal with the advantages and disadvantages associated with the BCG matrix as a portfolio analysis tool. In the end, we will sum our findings and draw a conclusion.
BCG Growth-Share Matrix
BCG Matrix is one of the most widely used and the oldest (developed in the 1970s) portfolio analysis tools available to management. This technique is usually used for multi-divisional or multi-product companies, which comprises of the organization’s “business portfolios”. This model has two controlling aspects namely relative market share (relative to the competition) and market growth (Scott p.140). The idea is that the bigger the market share the product has, the more cash it can earn, and the faster the product grows, the more investments are needed. The BCG Matrix tackles four types of scenarios: Star, Cash Cow, Dog, and Question Mark.
- Question Marks: These are products with a low share of a potentially high-growth market. They consume resources and initially have low-profit margins. They have the potential to become Stars. They absorb considerable financial and human resources (for R&D, marketing, production ramp-up, etc.) as you attempt to increase market share.
- Stars: These are products that are in high-growth markets with a relatively high share of that market. Stars tend to generate high amounts of income. Keep and build your stars.
- Cash Cows: These are products with a high share of a slow-growth market. Cash Cows generate more than is invested in them. So keep them in your portfolio of products as long as they generate appreciable cash flow and maintain market share.
- Dogs: These are products with a low share of a low-growth market. They do not generate cash for the company, they tend to absorb it. It is recommended to divest/discontinue these products and use the proceeds and savings to turn Question Marks into Stars.
The creation of value of a company, following this model, is given from the best composition of the product portfolio. Hence it may be considered as a useful tool to counteract the substitutes and rivalry forces. The scope in the long-term is to ensure value creation by combining product offerings while generating the largest amount of cash at the lowest level of capital investment. In this way, the same tool highlights those products that demand high investment efforts for low-growth products and that should be avoided.
Hewitt-Packard Company
The company under study is Hewitt-Packard Company (HP). We will use BCG matrix analysis to evaluate HP’s portfolio structure and present situation and then try and find the shortcomings of using this particular tool for portfolio analysis. To form the BCG matrix we will first study the different portfolios that HP has and their performance over 2007 vis-à-vis their competitors and market leaders. Once we have constructed the matrix we will conduct an analysis into the company’s present situation and evaluate them based on their competitors and try to ascertain how effective the BCG matrix is as a tool.
Product Portfolio of HP
In this section, we discuss the different products that HP has to offer and its competitors in those segments. HP provides a wide range of products and services to its customers and is divided into five business segments:
- Personal Systems: HP’s personal systems group (PSG) is responsible for the development and sale of HP’s commercial and consumer PCs, workstations, handheld devices, digital entertainment systems, notebooks, and other related services and accessories. For convenience, we segregate the PSG into two segments only – desktops and notebooks. In terms of revenue, HP is the largest producer of both desktops and notebooks with Dell coming in at a close second. However, the PC market is fragmented with the top ten companies accounting for only approximately 57% of global desktop sales. The notebook market is more concentrated with the top ten companies controlling over 80% of the market.
- Imaging and Printing: HP’s imaging and printing Group (IPG) provides consumer and commercial printer hardware, printing supplies, printing media and accessories, and scanning devices. The printer market is segregated into two product divisions – inkjets and laser printers. In this segment, HP’s competitors are Lexmark, Canon, Epson, Xerox, and Samsung. HP is the market leader for both types of printers.
- Enterprise Storage and Servers: HP’s Enterprise Storage and Servers (ESS) segment offers a wide range of servers and storage products and solutions for small businesses and larger corporations. In servers, the market leader is IBM, with HP coming second and Dell third.
- HP Services: This segment offers a large variety of information technology services, including technology services, consulting and integration services, and managed services. HP Services works with HP’s IPG and ESS segments in order to provide customers with end-to-end business solutions. In IT services IBM is the leader with the maximum profit earnings.
- Software: HP’s Software segment provides management software solutions that assist large companies in managing their operations and information technology infrastructure. HP’s competitors in this segment are BMC Software, IBM, and CA.
BCG Matrix – HP
Figure 1 shows the BCG matrix for HP’s product offerings. The products under consideration, as discussed earlier, are PC (which include desktops and notebooks), Software, Servers, Printers, and IT services. The whole matrix has been made on the basis of 2007 figures.
The calculations were done on the basis of the following formula. We calculated the relative market share as the ratio of the products’ sales in 2007 to the leading rival’s sales in 2007. And the market growth has been calculated as the ratio of the change (increase or decrease) of market sales from 2006 to 2007 to the total market sales of 2006. From the above figure, we clearly see that HP does not have any Cash cows or Dogs. Printers, which is one of the most consistently profitable products of HP is a star along with IT Services and its PC business partially. The server and Software are both in the question mark quadrant.
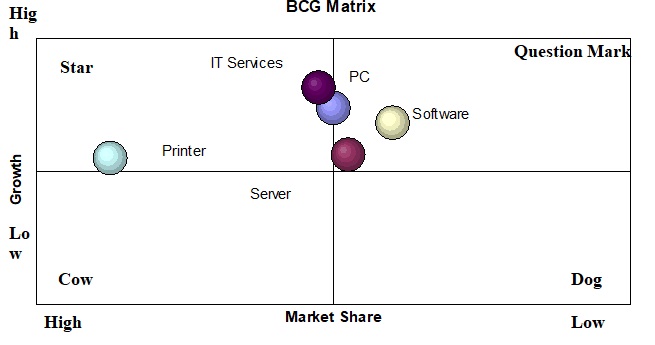
As in the case of Printers, HP holds a dominant share of the printing market with a share of 48% in 2006-07 with its next competitor, Cannon, securing a share of 18%. The growth of the industry has been moderate, so it is still in the star region but, it will gradually move into the cash cow region if the market growth keeps falling. IT Services has a high market growth rate, but its market share is 39% as compared to 37% of IBM, which is the next best competitor in terms of revenue. HP’s products which are included in the PC portfolio had an equal share of the market and hence the market share depicted for this product portfolio is 1 and it has a high growth rate. So these are the products that are cash consumers and have a steady cash flow. (www.wikinvest.com)
In the question mark quadrant, we will find the server and software. HP servers had a market share of 28% and that of the market leader was 31%. Hence we see that it falls in the question mark quadrant. Further, the server industry growth was moderately high. HP software had a market share of 9% in 2007 and that of the market leader IBM and BMC were 10%. The industry growth is pretty high. This region shows a large negative cash flow.
Based on these findings the strategies that should be adopted by HP are as follows. For the star performers, the BCG model suggests the following recommended strategies:
For the question mark products, this usually occurs to products introduced in a market with a high growth rate and an existing market leader. The strategies that are to be considered in this phase are intensive strategies. The strategic options that the model presents, in this case, are market penetration, market development, and product development.
For the star products, defending the leadership position becomes imperative. Stars are frequently only marginally profitable but as they reach a more mature status in their life cycle and growth slows, returns become more attractive, as in the case of printers. The stars being in their safe and secure phase provide the basis for long-term growth and profitability. The strategies that are advised to be taken in this phase are integration – forward, backward and horizontal, market development, market penetration, product development, and joint ventures.
Though this model is widely used for portfolio analysis purposes, it cannot be used as the only method for it has certain limitations along with its brighter aspects. In the next section, we will discuss the benefits and limitations of the BCG matrix through the matrix that we have developed for HP.
Benefits of BCG Matrix
As is always stated, BCG is a simple model to be used. It is easy to use and gives a fair idea regarding the company’s product positions. It is a model based on the product life cycle theory and hence shows the relative position of the products in their respective life cycle and their position in the market vis-à-vis their competitors. For instance, figure 1 shows that with respect to most of the products, HP is the market leader. Further, the ones in which it is not, it is in a very close run against the leader. Further, it shows that most of its products are still in their growth phase, and it does not require divesting any of its brands.
Limitations of BCG Matrix
The disadvantages that are associated with portfolio analysis with the help of BCG Matrix are as follows:
The BCG model is criticized for having a number of limitations (Kotler 2003):
- There are other reasons other than relative market share and market growth that could influence the allocation of resources to a product: reasons such as the need for a strong brand name and product positioning could compel resource allocation to an SBU or product (Drummond & Ensor 2004). As in the case of HP printers, it is considered to be the best brand in this category. Clearly, it is shown in its market share. But the market for this product is shrinking and thus, reducing the products’ industry attractiveness. Whereas, we cannot consider any other factor that may help us to retain the product’s leadership. Moreover, it fails to realize that IT services products have a short product life cycle as they are part of a highly technologically driven market. Here the growth rate, as well as the decline rate, is faster than other product markets. So the strategies that out to be taken in here are quick. Further IT services are basically provided in a B2B environment. Hence, the marketing and branding exercises will be different in this case. B2B marketing is totally different from B2C marketing. This aspect of the product is not considered in this model. Another important factor that goes unnoticed is the innumerable mergers that HP has undergone to grow, which is not reflected in the analysis. Other strategies like the competitive advantage of the products vis-à-vis competitors are not considered.
- The model rests on net cash consumption or generation as the fundamental portfolio balancing criterion. That is appropriate only in a capital-constrained environment. In modern economies, with relatively frictionless capital flows, this is not the appropriate metric to apply – rather, risk-adjusted discounted cash flows should be used. In other words, it is a static concept and not a flow concept. For instance, the model does not facilitate the understanding of the product’s stages of maturity. We come to know about the product’s present position on the basis of its current sales generation and market share, but what about the product’s status two years back? For example, printers are a star product in 2007, but it was a cash cow product in 2004, which is primarily due to the shrinkage of the product’s market, which is a factor that is not considered in this analysis. Moreover, after the merger with Compaq, HP is undergoing a cost-cutting strategy. But the analysis does not consider this.
- Also, the matrix assumes products/business units are independent of each other, and independent of assets outside of the business. In other words, there is no provision for synergy among products/business units. This is rarely realistic. As in the case of HP’s offerings, the IT services it provides to a great extent are related to its other business portfolios, especially servers and software. So considering the growth and share of the service portfolio in isolation may give a very skewed understanding. Moreover, it does not consider the fact that with shrinkage of the global demand of PCs the sale of printers may get affected.
- The relationship between cash flow and market share may be weak due to a number of factors including competitors may have access to lower-cost materials unrelated to their relative share position; low market share producers may be on steeper experience curves due to superior production technology; and strategic factors other than relative market share may affect profit margins. For example in the case of IBM in the server market or IBM and BMC in the software market. These are older players in the market and have gathered extensive experience in the business. HP on the contrary is a nascent player and thus has the disadvantage of a late mover in the market.
- In addition, the growth-share matrix is based on the assumption that high rates of growth use large cash resources and that maturity of the life cycle brings about the expected profit returns. This may be incorrect due to various reasons: capital intensity may be low and the business/product could be grown without major cash outlay; high entry barriers may exist so margins may be sustainable and big enough to produce a positive cash flow and a growth at the same time; and industry overcapacity and price competition may depress prices in maturity. This may not always be true. This is the case with Dell and HP. Dell though has been having similar growth rates as that of, HP faced a decline in growth mainly due to the market for consumer notebooks went up, and Dell’s primary customers were corporate, wherein HP succeeded (Schofield, 2007). But could have been a hindrance in HP’s growth too since the matrix does not talk of the changing market demands. Further, though HP’s printer business has been a star, most of the revenue that is earned in this product is not from the sale of printers, but from the sale of inkjets. This clearly makes the relative position of one of HP’s most profitable products obscure.
- Furthermore, market growth is not the only factor or necessarily the most important factor when assessing the attractiveness of a market. A fast-growing market is not necessarily an attractive one. Growth markets attract new entrants and if capacity exceeds demand then the market may become a low margin one and therefore unattractive. A high-growth market may lack size and stability. For instance, anyone seeing the HP printers’ position in the matrix will get attracted to its prospects, but the matrix does not reveal that the market for printers, globally, is shrinking. The matrix as shown above will not give a picture regarding the competition’s strategies and the new entrants who are likely to enter the market seeing the attractiveness of HP’s portfolio. But HP will be unable to check them for this matrix will not warn the company of the impending new entrants. Further IBM proposes to undertake a vertical strategy and open standards which the company believes will leave its competitors a long way behind (Linsenbach 2007).
- The model gives high emphasis on market share, whereas a product may maintain its niche market and still maintain high profitability. This has been the case with HP software. The product has high market attractiveness, but it is not a market leader, but still is a profitable business, whereas a printer which is a star product does not have a high, market attractiveness even though it has a high market share. As table 1 shows that the revenue growth of software was 79% in 2007 and that of printers was just 6.30%. The matrix clearly does not show this aspect of the portfolio.
Table 1.
Figure 2
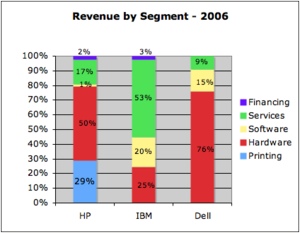
- The matrix does not show the portfolio of the competitors. It just gives a relative position vis-à-vis to the market leader. For instance, figure 2 shows the major competitors of HP, i.e. IBM and Dell are companies whose interests lie in different areas. For instance, IBM has most of its revenue from software, hardware (which includes all revenue from personal computers, servers, and storage products), and services and that of Dell is mostly from hardware and a bit from software. Clearly, HP is a more diversified company than the other two. But given their different focuses in business, HP cannot be dubbed as the market leader for the whole portfolio. But if we see the matrix in seclusion, it will bear the impression that HP is the sole market leader in most of the categories. HP earns most of its revenue from printers where neither of its prime competitors is present. Hence this matrix is not enough to do competition analysis.
- The model though assumes that a high growth rate should be accompanied by a high level of investment, for it is only the level of investment that will make the business sustainable. But the model does not mention what should be the cut-off for the level of investment. So as a printer and IT services are in the star quadrant, by the rule of the model, the company should be doing high investment in these products, but the level of investment is uncertain as well as the outcome, as printers may push in the cash cow state where investment in a market which is not growing will be absolutely wrong.
Conclusion
To summarize our findings we may say that the BCG matrix is a simple tool that will give a bird-eye view of the portfolio situation of a multi-product company. But the matrix fails when it concerns in-depth analysis. It fails in many aspects when the analysis has to be done on the basis of the external environment and to find out what would be the strategy of the competitors given that the company under study takes a certain decision. So to sum up we may say that the matrix is applicable in a closed system, static environment.
Reference
Linsenbach, Sharon. “IBM Looks to Services and Verticals to Beat Rivals” PC Magazine, 2007. Web.
Schofield, Jack. “How HP has overtaken the bigger boys of computing” The Guardian, 2007. Web.
Kotler, Philip. Marketing Insights from A to Z: 80 Concepts Every Manager Needs to Know, John-Wiley & Sons, 2003.
Drummond, G. & Ensor, J. Strategic Marketing: Planning & Control. 2nd Ed. Butterworth-Heinemann: MA, 2004, pp. 96-100.