Boston Beer Company has a myriad of top executives who hold several key positions in the company. The company’s President and CEO, in charge of all operations and chief decision-maker in terms of fiscal policies. With an average term that spans 8 years, Boston Beers provides a longer tenure than the direct competition which has an average of 6 years between renewals of contracts. The industry operates at a standard 6-8 years tenure while the business world as a whole has a limit of 8 years before the renewal of contracts.
Other executives within the organization include; the Vice Presidents in charge of Human resources, brewing, and Legal and deputy general counsel all serve terms that go for 8 years. This tenure also applies to the Chief Sales Officer, Chief Marketing Officer, and the Chief Accounting Officer. The competition and the industry have different leadership structures with different titles, still, serve a tenure of 6-8 years. However, the general business environment provides the top executives with contracts that average 5-8 years, depending on the industry and sector involved.
To measure the effectiveness of the management, the use of financial ratios comes in handy. Return on invested capital measures how well a company generates cash flow relative to the capital it has invested in its business. The weighted average cost of capital (WACC) is the rate that a company is expected to pay on average to all its security holders to finance its assets. By comparing these two data, it can be seen whether a company makes the most of the invested capital.
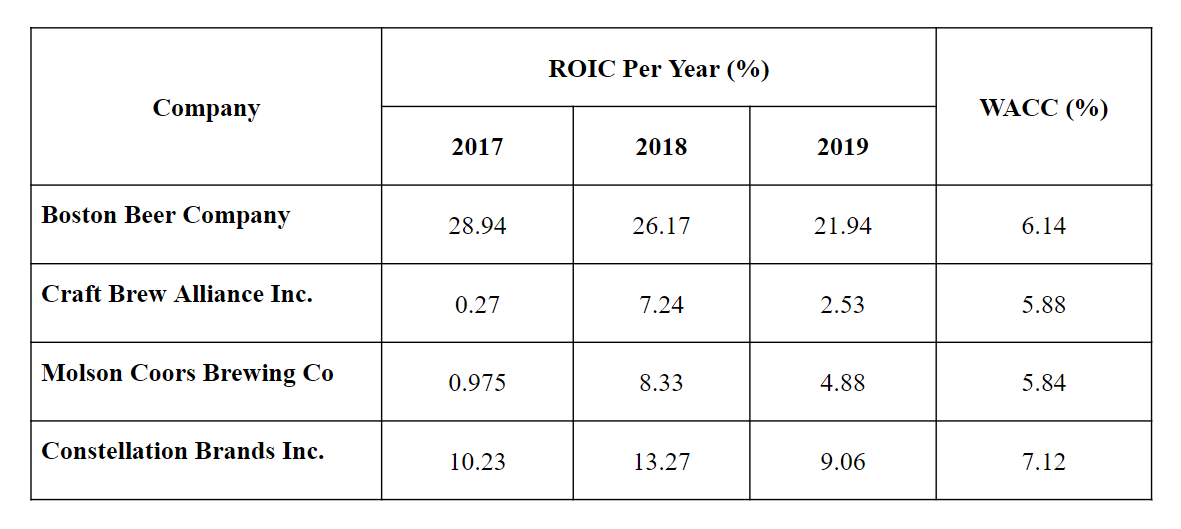
During the close of the financial year 2017, Boston Beers recorded an ROIC of 28.94%, then later recorded 26.17% at the close of 2018 and has a quarterly ROIC of 21.94% as of June 2019. With a WACC of 6.14%, the company generates more returns on investment than it costs to raise the capital needed for the investment. On the contrary, despite being the smallest party in the fray, Craft Brew Alliance has been able to get an ROIC of 0.27% for the year that ended in 2017. The financial year 2018 saw an increase to 7.24% while also recording an ROIC of 2.53% for half of the year 2019. The Craft Brew recorded a WACC of 5.88%. Molson Coors, one of Boston Beers’ main competition recorded an ROIC of 0.975% for the year 2017. The fiscal year 2018 saw a significant percentage increase to 8.33%. However, the company has recorded a drop in the ROIC to a percentage of 4.88. Its WACC sits at 5.84%. These two company currently are in danger as they are not generating enough income to offset the deficit of capital investment thus needs to review its strategies. Constellation Brands recorded a WACC of 7.12%. For the financial year ending 2017, the company recorded an ROIC of 10.23% while in 2018, they recorded an increase to 13.27% and currently have an ROIC of 9.06% for the beginning quarters ended June 2019. To this effect, the company is generating more returns than it spends on raising capital for investment.
A thorough analysis of the ROIC of Boston Beer compared to the other firms impresses on several assumptions. According to the data above, in terms of ROIC, Boston Beers have a more lucrative ROIC, which indicates it is growing much faster than the competition. However, Constellation Brewers are more liquid, thus are more likely to pay their stakeholders much faster than all the other parties involved.
Further dissection of the financial reports will be through the use of market capitalization. A company’s Market Capitalization is a measurement of company size. It is a calculation of the company’s share price multiplied by the number of outstanding shares. Firms with large capitalization offer stability and are beneficial for long-term investment. On the contrary, companies with smaller market capitalization can produce faster growth and bigger returns, however, they accrue a lot of risks.
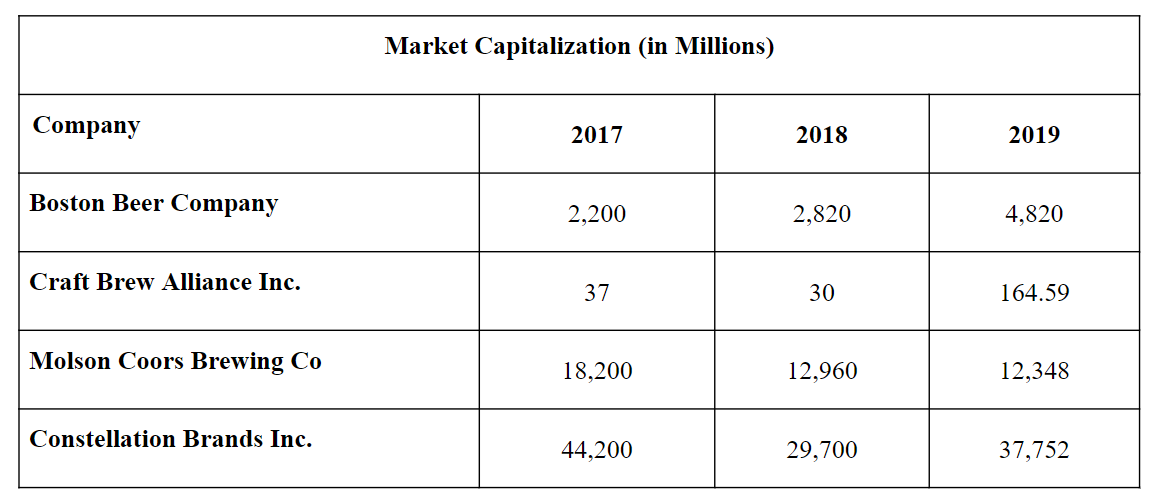
Boston Beers Company has an increasing market capitalization over the last three years beginning in 2017. For the period that ends in 2019, the company is enjoying a market cap of $4.82 billion which indicates that the company is steadily increasing its foothold in the industry and also stabilizing its shares as a public listed entity. On the other hand, Craft Brewers Alliance recorded a market cap of $37 million and $30 million for the financial year 2017 and 2018. During the financial year 2019, however, the company has a market cap of $164.59 million which increased massively.
This indicates that the company is being steered in the right direction. Molson Coors has had a rough season. Dropping from a market capitalization of $18.2 billion during the close of the financial period that was 2017 to $ 12.96 billion at the end of 2018. Currently standing at $12.348 billion, the company has not yet recovered from the decrease and should aim to improve on its policies to ensure healthy competition. Constellation Brand recorded a market cap of $44.2 billion which dipped massively to $ 29.7 billion. The significant loss led to radical changes that have seen the corporation increase its market capitalization to $37.752 billion, establishing it as the dominant player in the industry. This fluctuation indicates that the corporation had put in place defunct measures that needed to be changed to reclaim the majority of the market share.
EBITDA refers to earnings before interest, taxes, depreciation, and amortization. This figure is often used to assess a company’s profitability since it provides an accurate view of earnings and eliminates extraneous variables. For the same reason, it is a useful metric for comparing companies with varied capital structures.
With regards to EBITDA, Boston Beer Company shows worse results than Molson Coors Brewing and Constellation Brands. In 2018, the company’s EBITDA was $168 million, compared to $2502 million made by Molson Coors Brewing Co and $2889 million generated by Constellation Brands. These results can be partly attributed to the fact that Boston Beer Company is much smaller than the other two corporations, which inevitably affects its sales. Similarly, Craft Brew Alliance, which has the smallest market capitalization of the four firms, has an EBITDA of just $17 million. However, when comparing market capitalization and EBITDA differences between Molson Coors Brewing and Boston Beer Company, it is evident that other factors could be influencing the latter company’s earnings because the difference in EBITDA is not proportional to size variations.
Still, when comparing values over three years, Boston Beer Company does better at preventing significant EBITDA decrease than Molson Coors Brewing. The company’s EBITDA decreased from 187 to 167 between 2016 and 2017, whereas the other company lost almost half of its EBITDA. Craft Brew Alliance and Constellation Brands show a stable positive dynamic over the same period. Hence, the analysis of EBITDA figures shows that Boston Beer Company’s leaders may not be paying sufficient attention to sales growth. This could threaten the company in the future if some of its competitors continue to develop their EBITDA through enhancing sales and operations.
The debt-to-equity ratio shows the relationship between a company’s total liabilities and its shareholder equity. This ratio helps to evaluate a company’s financial leverage and suggests the extent to which it uses debt to finance its business operations. The ideal D/E values largely depend on the industry; however, lower ratios are generally preferred as an indication of low risk.
In terms of Debt/Equity, Boston Beer Company shows better results than its competitors. It had managed to maintain a score between 0.35 and 0.4 over the past three years, which indicates that the vast part of business operations is financed through the company’s funds. Craft Brew Alliance, although a small company, had a larger D/E ratio of 0.73 in 2019, Whereas Molson Coors Brewing and Constellation Brands had D/E values of 1.19 and 1.55, respectively. In all companies, the D/E values have remained relatively stable over the years, except Molson Coors Brewing. Between 2016 and 2018, this company has managed to decrease its D/E ratio from 1.52 to 1.19. Given the fact that its EBITDA also decreased in this period, this shows that the company has managed to decrease its liabilities substantially. For a large corporation, this is a good strategic move indicating proactive leadership, since a better D/E ratio could make it more attractive for investors.
The success of Boston Brewing Company in debt management is a sign of excellent corporate leadership. The low value of D/E contributes to the company’s overall financial profile, thus making it easier for it to find additional sources of financing. This, in turn, could help the firm to seize expansion and growth opportunities that come its way and improve market capitalization and profitability.