Background
The paper will carry out an analysis and comparison of the performance of BP PLC and Royal Dutch Shell PLC. The two companies were formed almost at the same time. BP PLC was established in 1908 initially as Anglo-Persian Oil Company while Shell PLC was established in 1907. Both companies are components of the FTSE 100 index. Besides, they are public entities that operate in the oil and gas industry. BP PLC is headquartered in London. Further, it has a primary listing on the London Stock Exchange. The secondary listings are on the New York and Frankfurt Stock Exchange. At the end of 2013, the company had operations in more than eighty countries, while the daily production stood at 3.2 million barrels. The main products of the company are Petroleum, natural gas, aviation fuel, petrochemical, and motor fuels (BP PLC 2015a). In the case of Shell PLC, the headquarters are located in the Netherlands. However, the company is registered in the United Kingdom. Further, Shell PLC has a primary listing on the London Stock Exchange. The secondary listings are on the New York Stock Exchange and Euronext Amsterdam. The company has operations in more than 90 countries. The current daily production capacity stands at 3.2 million barrels of oil equivalent. The key products of the company are petrochemicals, natural gas, and petroleum.
How they are placed in the industry
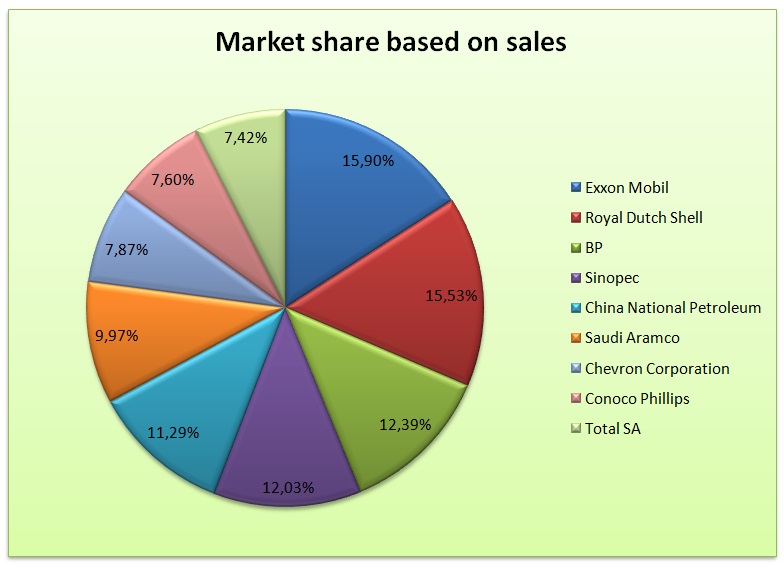
The oil and gas industry is quite competitive and is made up of large corporations. The table presented below shows a summary of sales for the key players in the industry.
(Source of data – International Energy Agency 2015)
The data show that Shell PLC and BP PLC come in second and third respectively in the world oil and gas industry.
Recent stock movement
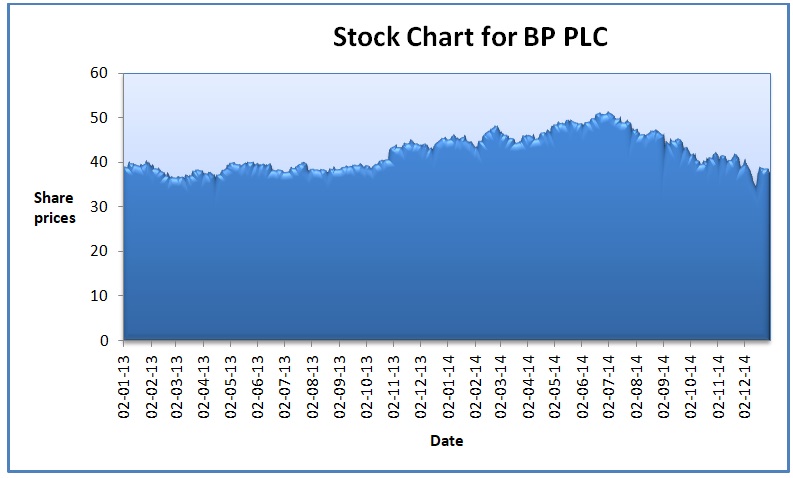
The graphs presented below shows the stock chart for BP PLC and Shell PLC. The charts are generated using stock prices of the two companies for a period of two years that is between 1st January 2013 and 31st December 2014.
BP PLC
Royal Dutch Shell PLC
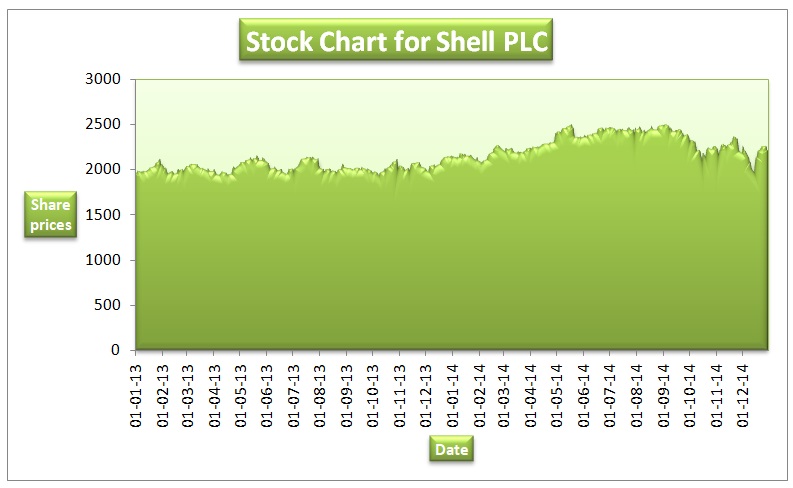
The stock charts for the two companies have a similar trend. There was a gradual rise between January 2013 and October 2014. This was followed by a slight decline from November 2014 (Yahoo Finance 2015a; Yahoo Finance 2015b).
Local and global economic conditions and industry trend
Since June 2014, the price of oil has dropped drastically. The current price per barrel is $43. There is disequilibrium in the oil and gas industry because supply exceeds demand. If this condition persists, then the oil producing companies are likely to run out of storage space. This will cause a further drop in the price per barrel. During the last decade, the demand for oil exceeded supply, and the price per barrel was expected to increase to $147 (International Energy Agency 2015). The dramatic shift in the oil market was not expected. This can partly be attributed to an increase in production over the past ten years.
The ability of the company to cope with the trends
The current trend in the oil and gas industry has impacted negatively both the companies operating in the industry and the overall economy. In order to cope with the recent trends, the two companies laid off a number of works. For instance, in the North Sea, BP PLC company laid off 300 workers. In the US, the total number of jobs that have been axed is 550 (BP PLC 2015c). Further, the company reduced the total annual spending by $23 billion (The Telegraph 2015a). These stringent measures were put in place to ensure that the bottom line and dividends are not affected by the market trends. In the case of Shell PLC, the company laid off more than 600 workers in the United States (The Telegraph 2015b). Other regions where the company operates were also affected. Further, the company announced an aggressive restructuring plan that will save the company more than USD800 million. Even though the companies in the industry are hurting, it can be noted that the two companies are able to cope with the recent trends.
Trend analysis
Income statement
The income statement of the two companies shows that the revenue dropped during the two year period. The sales for Shell PLC dropped by 6.55%, while that for BP PLC dropped by 10.47%. As mentioned above, this decline can be attributed to a significant drop in the price of oil per barrel. Since the cost of revenue is directly related to sales, the value dropped in the case of two companies. The gross profit margin for Shell PLC declined by 5.38%, while for BP PLC decreased by 42.40%. The high value in the case of BP can be explained by the fact that the cost of revenue dropped by a lesser proportion than sales. BP PLC does not incur the costs of research and development cost (BP PLC 2015a). The value dropped by 7.89% in the case of Shell PLC. A further review shows that there was a significant drop in the interest expense for BP PLC. However, in the case of Shell PLC, the value increased by 68.51%. With these changes, the total income before taxes for both companies dropped. The net income for Shell PLC declined by 10.06%, while for BP PLC by 520.40%. The income statement shows that BP was worst hit by the trend in the oil and gas industry than Shell PLC (Royal Dutch Shell PLC 2015). The values are presented in appendix 1.
Balance sheet
The balance sheet shows that the current assets dropped by 3.45% in the case of Shell PLC and 9.89% for BP PLC. There were significant movements in the balances of cash, inventory, and receivables for both companies. The total non-current assets of both companies also dropped. Shell PLC had a decline of 0.33%, while BP PLC had a drop of 5.56%. Under non-current assets, the value of the gross property, plant, and equipment for BP PLC rose by 4.77% while for Shell PLC dropped by 1.86%. The two companies experienced a significant increase in deferred income taxes. Shell PLC has a 138.34% increase in intangible assets. The total current liabilities for both companies decreased by 7.56% in the case of Shell PLC and by 12.63% for BP PLC. The total liabilities for Shell PLC rose by 2.08%, while for BP dropped by 2.00%. The total stockholder’s equity of both companies dropped. The percentages show that the financial standings of the two companies shrunk. The calculations are presented in appendix 2
Cash flow statement
Despite the deterioration of performance, the net cash flow generated from operating activities increased for both companies. The value rose by 11.38% for Shell PLC and 55.23% for BP PLC. The net cash flow used for investing activities dropped by 51.04% in the case of Shell PLC. For BP PLC, the value rose by 149.19%. The net cash flow used for financing activities rose by 42.46% for Shell PLC. In the case of BP PLC, the value dropped by 49.37%. The net change in cash and the free cash flow rose in the case of the two companies. The values are presented in appendix three.
Ratio analysis
Profitability
The two companies had a drop in the ability to manage the cost of sales and operations in order to generate growth in net earnings as shown by the decline in net earnings. Further, the proportion of net income that was generated from the assets and equity also declined. BP PLC had a larger percentage of decline than Shell PLC. The decline in the profitability ratios of the two companies can be attributed to the significant drop in the selling price of their products. When compared to the industry average, it can be noted that the two companies performed dismally (Petty, Titman, Keown, Martin, Martin, Burrow & Nguyen 2012).
Liquidity
There was a slight improvement in the liquidity ratios for the companies during the period. This was caused by an increase in the balance of current assets of the two companies. The rise in the values of the current and quick ratios shows that the ability of management to pay current obligations using current assets improved. Also, BP PLC had a higher level of liquidity than Shell PLC. The performance of the two companies was better than the industry average.
Efficiency ratios
The day’s sales outstanding and receivables turnover of the two companies deteriorated. This shows a decline in inefficiency in the collection of debts. The performance of the two companies in 2014 was lower than the industry average. The day’s inventory and inventory turnover for the two companies improved. However, the values were lower than the industry average. The payables period for the two companies increased. This implies that the companies are taking a much longer time to pay the creditors. Further, the number of sales units generated from a unit of fixed assets and total assets dropped for the two companies. However, the performance of the two companies was higher than the industry average. Thus, it can be noted that there was a general decline in the efficiency ratios of the two companies. Further, the efficiency level of Shell PLC was higher than that of BP PLC.
Leverage ratios
The leverage level of the two companies rose as indicated by the increase in the value of the debt to equity ratio. Further, The leverage level for BP PLC was higher than that of Shell PLC. Also, the leverage level of BP PLC was higher than the industry average. It is worth mentioning that a low leverage level gives companies room to grow. The solvency ratio (interest coverage) ratio for the two companies dropped significantly. This shows that the ability of the companies to pay interest expense using earnings before interest and tax dropped. This was attributed to the drop in earnings. Further, it can be observed that BP PLC had a lower level of solvency than Shell PLC. The solvency of the two companies in 2014 was lower than the industry average.
Market-based ratios
Despite the drop in earnings, the price-earnings ratio for the two companies improved in 2014. The values were higher than the industry average. This implies that shareholders should expect higher returns in the coming years. The price to book ratio and price to sales ratio for Shell PLC remained constant while those for BP PLC dropped. A summary of the ratios is presented in appendix 4.
Recommendation
An investor should not invest in either of the companies. The recommendation is based on the fact that the two companies reported a decline in performance in 2014. Therefore, the investor should continue to monitor the trend so as to establish if it will persist in the future.
Conclusion
The paper carried out a comparison of the performance of Shell PLC and BP PLC. The results show that the recent market trends had a significant impact on the performance of the two entities. The analysis above was able to point out the recent trends in the oil and gas industry. The discussion above also revealed that Shell PLC performed better than BP PLC despite the fact that the performance of the two companies deteriorated. As weakness and limitation, the two year period was short. It was important to carry out the review for a period of longer than two years. Also, qualitative and quantitative analysis was limited. Additional tools ought to have been used to compare the performance of the two companies.
References
BP PLC 2015a, Annual report, and form 20-F 2014, Web.
BP PLC, 2015b. Investors – annual reporting, Web.
BP PLC, 2015c. Statistical review of world energy 2014, Web.
International Energy Agency, 2015. Oil market report, Web.
Petty, J, Titman, S, Keown, A, Martin, J, Martin, P, Burrow, M & Nguyen, H 2012, Financial management: principles and applications, Pearson Australia, NSW.
Royal Dutch Shell PLC 2015, Annual report 2014, Web.
The Telegraph 2015a, Latest energy, Web.
The Telegraph 2015b, Royal dutch shell B, Web.
Yahoo Finance 2015a, BP p.l.c. (BP), Web.
Yahoo Finance 2015b, Royal dutch shell PLC (RDSB.L), Web.