Introduction
British Petroleum – BP ranks third among the worlds largest producer of ol and natural gas. The organisation is among the top 6 energy sector companies and is active in the oil and gas exploration, petroleum products refining and marketing and non conventional energy systems. For the year ending 2007, it had total revenue of 291.438 billion USD and has about 96,200 employees across the world. The company operates oil and gas fields in a number of countries through joint ventures and partnership programs, as demanded by the governments in foreign countries. This paper presents a marketing plan for the company and proceeds by first performing a situational analysis of the energy sector and then examines the environmental conditions in which the company operates.
Situational Analysis
Before commencing with the marketing plan, it is important to first perform a situational analysis of the company and the environment in which it operates. Based on these outcomes, the marketing plan can be designed to handle the exigencies.
Internal Factors that Effect the Company
BP has a strong tradition of innovation, corporate governance and use of high-end technology in carrying out the oil exploration activities. Some of the internal factors that effect the company performance are explained in this section.
Technology Factors
BP has initiated many new technology initiatives that will help the company to meet the rising challenges and demands for more energy (Technology, December 2008). Some of the technology factors are given here:
Seismic technology -BP has developed a new seismic imaging technique called Wide Azimuth Towed Streamer, that helps in exploring oil reserves deep beneath natural salt formations. Conventional systems cannot peer so deep into such rock formations and the innovation has helped to find massive oil reserves in the Gulf of Mexico and Egypt this boosting the proved natural reserves by more than 100 % and reducing the finding cost per barrel.
X Technology – BP has developed the X Technology to improve the manufacturing process of Purified Terephthalic Acid, which is the basic building block for Polyester. This technology requires lesser resources such as water, eliminates emission of volatile compounds and helps to reduce pollution.
Carbon capture and storage – BP is testing an advanced technology that allows them to capture CO2 from the produced gas and inject it back into underground natural reservoirs. This process reduces CO2 emissions by 90% and helps in fighting global warming.
Using Digital Technology – BP team has developed advanced digital systems that create an interactive virtual environment. This technology allows BP teams to manage the data flow from the field more efficiently, enable quick decision-making and resolve problems faster. In the oil field of Valhall, the recovery of oil has increased by 60 million barrels.
Drilling Operations – BP has been rated as one of the top drillers and operates drilling rigs that drill up to 8,800 meters deep. The technology innovations have helped it to enhance the oil recovery in may oil wells and increase the life of the oil wells by more than 50%. In Prudhoe Bay, Alaska, the oil recovery has been increased by 5 billion barrels.
SLAM- Speed up LP Application Models (SLAM) increase by ten-fold, the speed of refinery feedstock selection and production planning thus reducing the production costs.
Fuels and Lubricants – BP has introduced low-sulphur fuel called Ultimate that cause lesser pollution. Castrol Syntrans Max that increases the replacement interval for heavy duty transmission to about 500, 000 kilometres and this reduces the pollution caused by disposing spent lubricant.
Operational Factors
BP has three main divisions through which it services over 13 million customers daily. The three divisions are: exploration and Production, Refining and Marketing and Gas, Power and Renewables. The strategy that the company has employed indicates optimisation of production facilities where the returns or recovery systems are enhanced and the company wants to consolidate its position as a first mover in the biggest oil fields. BP is also focused on improving the condition of some declining assets in areas such as Alaska, Egypt, Middle East and North Sea. Focus areas for exploring are Gulf of Mexico, Trinidad, Angola deep water off the west coast of Africa, Algeria, Egypt and Sakhalin near Taiwan. According it has started 24 projects in these regions and the will commence production in the year 2006 – 2008. Some of the projects are ACG Phase 3, Angel, Atlantis, Australia LNG T5, Cannonball, etc. Another 26 wells are under appraisal and these projects are Alaska Gas, Atlantis North, Flank, Block 18 West, etc. In addition to these, 24 projects have already commenced production in the years 2003 – 2005 and some of the projects are Trinidad Train 3, Jasmim, Xikomba, Mardi Gras, In Salah, etc. In addition, the company has also invested in the energy segments of non-conventional sources such as solar, wind, biogas, etc. BP currently has 52 double-hulled oil tankers that form a part of its international shipping fleet (Financial Report, 6 February 2007).
Financial Factors
There has been a drop observed in the third quarter of 2008, when compared with the first quarter of 2008. The results are given in the following table. All financial figures are in $ Million.
Exploration and Production division’s fourth quarter result was less mainly due to the lower gas prices and realizations and lower reported volumes. The results were also lower because of inflation in certain sectors, investments in new projects that were taken up. Refining and marketing has shown lower results because of the Texas storms that disrupted the supply lines and caused a number of refining units to be shut down. BP had anticipated the cost per barrel of crude at $60 while the rate during this period was $59.50 and this resulted in a drop in the market realization. Gas, Power and Renewable shows higher results and this is due to the non-operating gains when compared with a net non-operating charge in the same period last year, partly offset by lower contributions from the gas marketing and trading. The financial goals of the company include increasing production by about 4% a year to 2010 in a $40/bbl price environment; keep costs in control and controlling cash costs that is less than the general inflation index and to spend about $15 billion from 2006 onwards in organic growth and increase it at 0.5 $ billion per year (Financial Report, 6 February 2007).
SWOT Analysis
A SWOT analysis giving the strengths, weakness, opportunities and threats are given in this section (Deutsche Bank. 2004) (BP Sustainability Report, 2008).
Strengths
BP has sound financials and is a good adopter of technology. The company has kept out of troubled areas such as Nigeria and has its oil wells in Alaska, Australia and other areas. The company also has a good reputation with enhanced corporate social responsibility in place.
Weakness
Many of the oil wells are in offshore locations and there is a constant danger of natural calamities, hurricanes and other such natural disasters. Many of the oil wells that are in use are long past their prime and the recover figures are getting reduced. This makes it expensive for the company to recover oil as many of the oil wells are beyond the peak oil stage. The company is not very strong in natural gas extraction, LPG, LNG and other markets.
Opportunities
The future for energy sector is in the renewable energy and natural gas markets as oil reserves are getting depleted across the world. In another few years, solar energy and wind energy would make a strong appearance. There are excellent opportunities in the refining and distribution of oil products.
Threats
Oil reserves are getting depleted fast and within a few decades, the company will not be able to function anymore. There is also intense criticism about the manner in which oil companies operate and the pollution they cause.
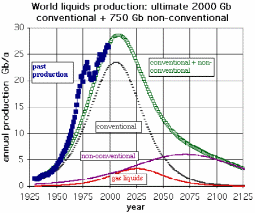
As per the Hubert Peak Model, that for in any specific area, which may be a region, state or country oil production rate would follow a curve that is bell shaped. The type of curve that is selected would help to determine factors such as the point of peak production that is based on the rate of new discovery and the rates of normal as well as cumulative production. Crude oil and gas also faces increasing threats from solar energy and wind power that are regarded as clean and renewable energy sources and also from coal which would last for another 300 years.
External Factors the effect the Company – PESTLE
There are a number of external factors that effect the performance of the company and these are discussed in this section.
Political Factors
Politics and oil are very closely linked in many underdeveloped countries that have large amounts of oil deposits. Many of the African and South American countries are very poor and run by corrupt dictators who indulge in widespread corruption and the people earn less than a dollar per day. These governments demand exorbitant share in the oil profits and oil companies have to oblige or else they would have to abandon the oil fields. In addition, the Gulf region, Nigeria, Sudan and other areas are prone to terrorists attacks that cripple the oil infrastructure (Shaxson, 2007).
The Organization of Petroleum Exporting Countries – OPEC has a number of member countries such as Saudi Arabia, Kuwait, Nigeria, Indonesia, United Arab Emirates, Ecuador, Qatar, Venezuela and other countries. These countries produce almost 2/3 rd of the world demand for crude oil and in 2008 March, these countries contributed almost 36 percent of the oil. The main agenda of OPEC is to find the optimum way to ensure that the member nations oil production and sale are stabilized. OPEC tries to ensure that the international oil markets are stabilized, irrational price fluctuations are removed and that the interests of the OPEC member nations are protected. The organization also aims to ensure that the member countries are assured of a reasonable and justified price for oil crude. However, OPEC is more than a trade organization and t is seen as the mastermind that influences prices across the world by the simple act of reducing production so that demand rises and there is an increase in the price, a fact denied by OPEC. In the mid 70’s OPEC used oil as a weapon to force embargo on Western countries that supported Israel during the war with Syria and Egypt. During this war, OPEC members started to reduce production and this caused a huge spurt in oil prices and demand fell short of supply and created wide spread fears of oil shortage. In recent times, OPEC has had rivals as other non OPEC countries such as Canada, the Gulf of Mexico, North Sea and other areas have started yielding good quality of oil. Other rivals include OECD and the countries created after the fall of Soviet Russia that together contributes 43% of the oil requirements. But these countries use the oil they produce and very little of their produce is exported and OPEC is still the largest block that exports a major part of the oil produced (Deutsche Bank, 2004).
Economic Factors
The price of crude oil has seen huge upswings and downswings. In July 2008, the price of crude per barrel reached an all time high of 147 USD per barrel. The world was held at ransom by the high prices and governments across the world were in trouble. A few months later, with recession gripping the world, the price of crude oil reduced to less than 40 USD per barrel. Crude oil price has a ripple effect on the economy and it would have a domino effect on the prices of energy, transportation, food and all sectors of the economy. When the price was high, oil companies make reasonable profits and when the price falls, they are left with large assets that have to be kept operational at loss (ASB. 2008).
Social Factors
Oil and gas natural wealth are supposed to bring prosperity to a nation that have ample oil reserves such as Nigeria. However, rampant corruption in the governments ensure that oil revenues are cornered by only a select few social groups while the rest of the population withers in poverty. Worse, activities of the oil and gas exploration cause widespread pollution, place agriculture and other industries take a backseat and the country ends up importing large quantities of food materials. In addition, many countries provide subsidised fuel to their citizens and when crude prices rise, the oil producing nations suffer a huge loss. Even in developed countries, people are subjected to misery when oil prices rise (Aboribo. 2001).
Technology Factors
With oil reserves falling across the world and oil wells having crossed their peak oil, there is a need to invest in technology such as advanced oil recovery methods. These technologies are difficult to maintain, expensive to operate and they reduce the oil and gas margins (NBR, 2007).
Legal Factors
Oil and gas exploration is subjected to various contracts, biddings and other terms that are enforced by foreign governments that invite bids for oil exploration contracts. In addition, oil companies are not allowed to open a 100% owned company but they have to enter into collaborations with foreign governments that sometimes ask for majority holdings. There is the added risk that in some underdeveloped countries, the government may decide to nationalise the oil sector and this has happened in Venezuela (Imevbore, 2008).
Environment
The environment is the worst sufferer from activities of the oil companies. There have been numerous incidents of oil spills that cause pollution of the rivers, lands and seas. Gas flaring causes air pollution and even consumption of fuels for transport and energy generation causes rapid rise in global warming gases (Energy Compass, 2008).
Summary of the Situational Analysis
The situational analysis suggests that oil and gas sectors are seeing a decline in terms of reserves and the world’s supply would be exhausted in a few years from now. Existing oil wells have crossed the peak oil a few years back and are showing declining production and the cost of recovery is getting higher. There is also intense competition in the oil sector that is subjected to a number of political and other forces that reduce the opportunity and rewards in the oil and gas sector. BP needs to examine other sources for the future and investment in renewable sources such as solar and wind are recommended. The organisation can at the best consolidate its operations and reduce exposure to risky investment and at the same time explore alternate energy generation and distribution.
Business Plan
The business plan is a blue print to the strategic road map for the company. The plan is to be created only after an assessment of the company using SWOT and an assessment of the external macro environment in which the company operates. As discussed in section 1, the oil and gas sector is witnessing poor growth rates with high competition. It is proposed that the new venture that BP wants to enter should be in the Solar energy sector. The business plan is accordingly targeted to providing the inputs for the solar energy systems.
Steps in Project Planning
Lewis (2000) has suggested that project planning has to be done as per discrete steps and these are illustrated in the following figure.
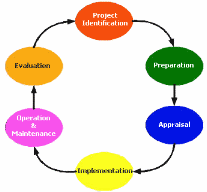
The steps are: project identification, preparation, appraisal, implementation, operation and maintenance and evaluation.
There are a number of success factors for projects and these are indicated in the following figure.
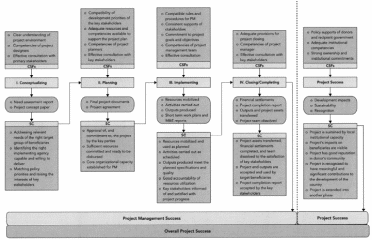
The project should be viewed in the perspective of the project life cycle and needs to be open ended so that any contingencies can be factored into the plan. Please refer to the above figure that illustrates the project life cycle. It is forecasted that projects with a specific project life cycle plan have a high success rate.
Ansoff Matrix
The Ansoff Matrix is a tool that provides alternative growth strategies for a company and helps planners to find ways in which the company would expand. According to the matrix, growth can be achieved through Market Penetration, Market Development, Product Development or through Diversification. In the previous section, the oil and gas sector has been analysed and it is concluded that the industry is seeing increased competition and depletion of resources. Hence product development with diversification into renewable energy source such as solar has been proposed (HBR, September 1998).
Diversification into new Markets
Schniederjans (1998) reports that multinational corporations – MNC have take up diversification as the means to increase revenues and enter new markets, breaking free from their existing strongholds. When a company wants to enter a new market, it needs to assess the risks such as business and financial risks before entering the market. To mitigate the risks and uncertainties of foreign countries and also because some countries do not allow 100% FDI, these use a number of vehicles to ensure that their interests were protected. Please refer to the following figure.
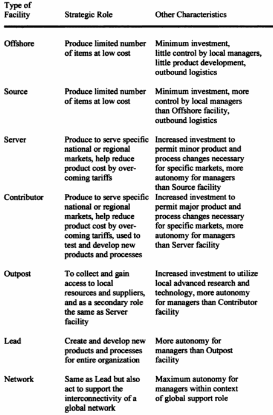
As seen in the above figure, MNCs used different types of collaborations and partnerships to set up firms in third world countries and business and marketing functions became integrated with their operations. Where the operations were important, MNCs formed joint ventures if the host countries did not allow 100% foreign owned subsidies and kept control of the operation, manufacturing, purchase and other departments. Such an arrangement allowed the MNC to use benchmarks defined in their home countries and demand the same performance from the vendors. Schniederjans (1998) points out that once the business process were integrated, then all aspects of quality and operations were controlled by designing requirements for the factory layout, machine and tool specifications and makes, process parameters, quality plan and other aspects were followed. Operations management practices from the home countries could then be used in the host third world countries after localising them to suit local conditions.
Examining the Value Chain
Porter (1996) suggested the value chain analysis that represents a chain of activities through which products pass through. Each activity adds value to the chain. What is important in the value chain analysis is the dynamics of the market and the exposure that the firm has had to the new business it is planning to enter. An illustration of the chain is as given below.
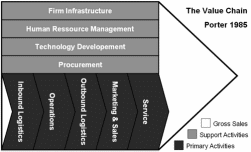
BP is in the energy sector and the new venture of solar energy is a part of the energy sector. Only the fuel and the nature of generation is different. Hence all elements of the existing value chain can support solar energy activities. It should be noted that the proposal is not for BP to exit oil and gas exploration but only to diversify into the solar energy sector while it continues to operate in the oil and gas sector.
Techno Commercial Analysis on Solar Energy
Solar energy is the most abundant source of renewable energy on our planet and the source of energy, via plants and photosynthesis, which fuels life. However, its exploitation as a means of generating electricity has developed only slowly. With pressures of high oil and gas prices and concern over global warming have forced governments and businesses to increase investment into solar technologies and these now show real promise and are on the verge of a major breakthrough in terms of deployment. Many nations in the developed world have taken to solar energy and there are increased instances of solar energy being used for power generation both for homes and industries since the fuel is free and it does not cause any pollution while generation. Africa is a nation where more than 90% of the population do not have access to the electricity grid and million of villages and communities live in remote and far flung villages that are not connected by road. People in these communities are forced to use bio fuels for power generation and this leads to increased deforestation. Without electricity, rural communities still relay on stone age agricultural practices that give low yields and the produce has to be immediately consumed or sold and water for irrigation and drinking has to be carried by hand. Education of children suffers since children are needed to work in the fields, fetch water and without power, they cannot use computers and study in the evenings and consequently another generation of children grow up as illiterate (AT, September 2007). Solar power would provide the solution to address the basic needs of such poor communities and to a certain extent, meet the power demands of heavy industries by employing integrated solar and thermal energy plants.
When it comes to using solar energy, two types of solar systems have been developed and they are Photovoltaic systems – PV and concentrated solar power systems CSP. PV systems use solid state thin film solar cells that are made from semi conductor materials such as polycrystalline silicon, cadmium telluride and others and these generate a charge when solar rays of sufficient radiation falls on them. The cells are arranged in series on solar panels and hundreds of cells make up a panel and many panels are connected to form the PV system. In addition, this system requires devices such as inverters, charge controllers, storage batteries and electrical wiring and these units are commonly used for households and small rural electrification projects. concentrated solar power systems have a large field of heliostat mirrors that focus sunlight onto a central receiver located in the middle of the heliostat field. A parabolic trough power plant uses special parabolic reflectors, which are deployed in long-trough shaped modules while solar dishes use individual parabolic dishes, each fitted with a power-generating unit at its centre. Temperatures as high as 600 degree centigrade can be generated and the heat is transferred to water or molten salts to generate steam that is used to power turbines and generate heat and these system are designed for large power generation plants and require high technology (NREL, 2007).
Estimates for the cost of installing solar generating capacity varies widely. The current installed cost of a solar thermal plant is between Euro 3,000/kW and Euro 8,000/kW. Solar photovoltaic costs are generally higher still with benchmark costs of between $5,500/kW and $8.500/kW in 2005 according to the US Department of Energy. The California Energy Commission puts the 2007 figures even higher, with utility PV costs over $9,500/kW. The following table gives installed cost figures for a variety of different power generating technologies. The table shows the base unit size and the instant cost in 2007 $, ignoring any loan repayment costs. The cheapest generating technologies listed in the table are a conventional and an advanced combined cycle plant with instant costs of $781/kW and $766/kW. These costs are significantly lower than any others in the table and the next technology is 2.5 times more expensive and go some way to explain why combined cycle technology remains attractive to generating companies in spite of the high cost of gas. The next cheapest technology is wind with an instant installed cost of $1,959/kW. Wind is the most competitive of the major renewable technologies today. The only coal-based technology in the table, integrated gasification combined cycle (IGCC), has an installed cost of $2,198/kW while an advanced nuclear plant is expected to cost $2,950/kW (NREL, 2007).
Table 2.1. Conventional/ Renewable costs for power generation in $/kW, 2007 (NREL, 2007)
In comparison with other technologies, solar power is expensive. The cheapest solar technology is a parabolic trough power plant with an instant cost in 2007$ of $4,021/kW. A concentrating solar photovoltaic plant costs $5,156/kW and a solar dish $6,187/kW, while a utility flat plate solar photovoltaic plant is the most expensive with an installed cost of $9,611/kW. This section examines estimates for current costs and future cost projects for both solar photovoltaic and solar thermal generation.
There is tremendous scope for BP to enter this sector and big energy companies have not entered the segment and BP would have the advantage of the first mover.
Conclusion
The paper has examined the diversification proposal for BP and analysed the internal environment and the external environment in which the company operates. The oil and gas sector is witnessing a steady downfall in productivity and there is a rapid decline in oil reserves across the globe. In a few years from now, oil and gas reserves would be exhausted. Moreover, the oil and gas sector suffers from intense competition, corrupt developing governments that demand exorbitant amounts to allow oil companies to operate and the oil infrastructure is always under the threat of terrorists. In such a case, entering into new ventures in the same industry is not advisable. It has been recommended that BP should explore the solar energy sector as it has tremendous scope for the future and the energy is renewable and does not cause pollution. A techno commercial analysis has been given for solar energy and BP can actively invest in this key growth area.
References
- Aboribo, Igho R. 2001. Oil, Politics and the Niger Delta Development Committee: The Tussle for control and Domination’. African Journal of Environmental Studies. Vol. 2, No 1 2001. Development Africa Consortium
- ASB. 2008. Annual Statistical Bulletin 2006: OPEC.
- AT. June 2007. Solar Power Good Way to Pump Remote Wells. Ranch and Rural Living. Volume 88. Issue 9. pp: 31-32
- BP Sustainability Report, 2008. Making Energy More.
- Cooke-Davies,T. 2002. The “real” success factors on projects. International Journal of Project Management, 20, pp: 185-190
- Deutsche Bank. 2004. Major Oils. Annual assessment of the strategies and valuation of the world’s largest integrated oil companies
- Energy Compass, 2008. Nigerian Oil and the Major Player. Volume 9, Issue. 3
- Financial Report, 2007, Group Results Fourth Quarter and Full Year 2006.
- Ghazvinian John. 2007. The Curse of Oil: Niger Delta, Nigeria. The Virginia Quarterly Review. Volume 83. Issue 1. pp: 4-29
- HBR, 1998. Harvard Business Review on Strategies for Growth. Harvard Business School Press
- Imevbore, A. M. A. 2008, ‘The Impact of Oil Pollution on the Biota of the Nigeria Delta’, in The Petroleum Industry and the Environment of the Niger Delta, Ministry of Petroleum Resources, Lagos, Nigeria, pp. 87-107
- Lewis. James P. 2000. Project Planning, Scheduling & Control, 3rd Edition. McGraw-Hill
- NREL. 2007. Power Technologies Energy Data Book Fourth Edition: National Renewable Energy Laboratory.
- Porter, M. E. 1996. What is strategy? Harvard Business Review. pp. 61-78
- Schniederjans. Marc. J, 1998. Operations Management in a Global Context. Quorum Books
- Technology, 2008. Technology where it really counts.
- NBR. 2007. The Directory of the Oil & Gas Industry. Nigerian National Petroleum Corporation, Nigeria, Abuja