Introduction
The present report was commissioned by the Chief Research Analyst. It presents the analysis of data provided by the Department for Business Innovation and Skill (BIS). The purpose of the present report is to compare the South East region with the North West region in terms of similarities and differences in business development.
The present report covers four essential matters. First, it provides background information about the dataset using descriptive statistics. Second, South East and North West regions are described by analyzing the selected variables. Third, the two regions are compared in terms of similarities and differences. Finally, recommendations are provided for the future development of business in these regions.
Dataset Overview
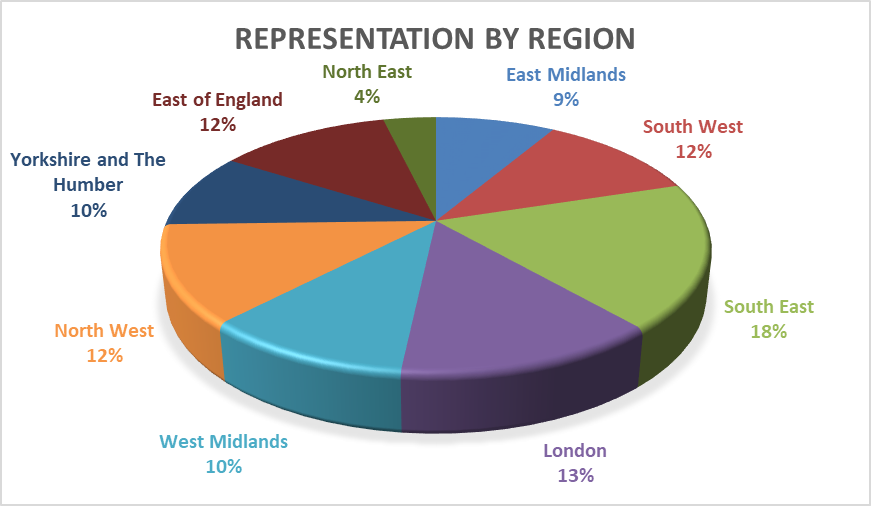
Before analyzing the regions, it is beneficial to understand the structure of the dataset to establish the reliability and validity of the information. The dataset was acquired by conducting a survey in nine regions of the UK, including East Midland, South West, South East, London, West Midlands, North West, Yorkshire and The Humber, East of England, and North East. The distribution of respondents by region is provided in Figure 1 below. According to the analysis, the South East region is over-represented with 18% of all respondents, while the North East region is underrepresented. Even though there may be a concern with the reliability of data received from the North East region due to a comparatively small sample, it does not affect the findings of the present report, as it focuses on other regions.
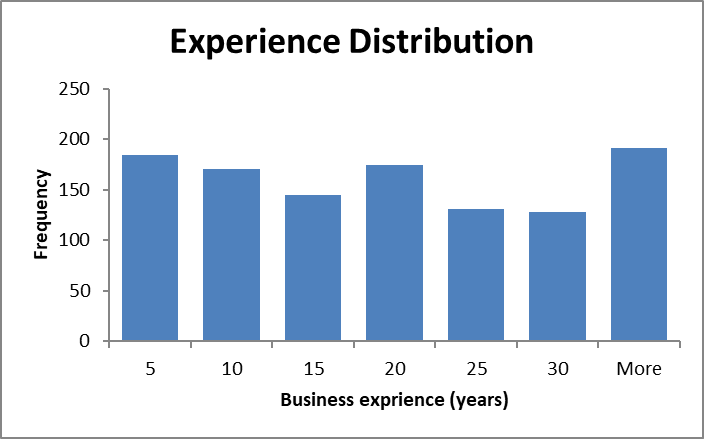
The questionnaire assessed 362 variables using the 1203 responses of entrepreneurs of different ages and experiences. The age of the respondents followed the normal distribution pattern with a mean of 44.9 and a standard deviation (SD) of 12.13. The experience of entrepreneurs was equally distributed among different groups. The distribution of respondents’ business experience is presented in Figure 2 below.
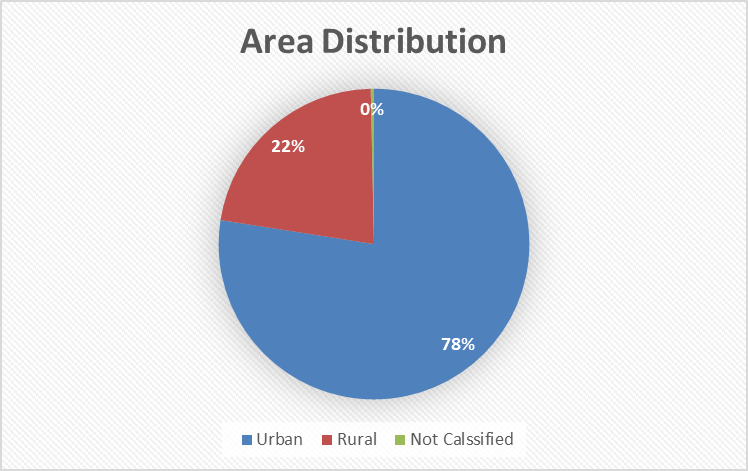
The respondents were also described using the area of conducting business. The distribution of respondents by area is presented in Figure 3 below. The analysis demonstrates that entrepreneurs from urban areas outnumber representatives from rural areas. This implies that the findings of the present report mostly concern business owners from urban areas.
In summary, while there are certain limitations to the information from the dataset, sample characteristics are adequate to draw conclusions about the South East and the North West regions.
Description of Regions
In order to achieve the purpose of the present report, seven variables were selected to compare the regions. The selected variables were the following:
- The central objective of business for the past three years/since establishment (Q5_1);
- The central objective of business for the next three years (Q5_4);
- Estimated turnover rate (Q5_11);
- Changes in turnover rate during the last 12 months (Q5_12);
- Age;
- Experience;
- Area (rural/urban).
The information from the dataset was transformed to make the information more manageable and comprehendible. All the information was sorted into different tabs to make file navigation easier. Raw data, selected data, and analysis by region can be viewed in the attached Excel file in the corresponding tabs.
South East Region
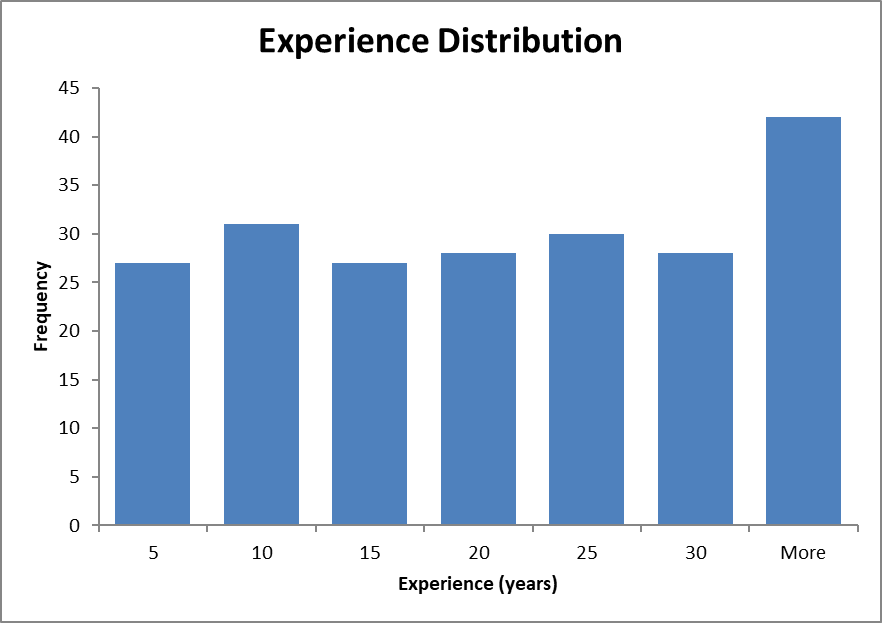
The analysis of the region’s business health was based on the data acquired from 222 respondents aged between 18 and 79. The age distribution of the participants followed the normal distribution pattern with the mean of 44.7 and SD of 12.7, which is similar to the mean and SD of the entire sample. However, mean business experience in the region (34.5 years) differed considerably from the mean of the whole sample (19.2 years). This may be a sign of a lack of young entrepreneurs in the region. The distribution of business experience is presented in Figure 4 below. The majority of the respondents (75%) were from urban areas, and 25% were from rural areas.
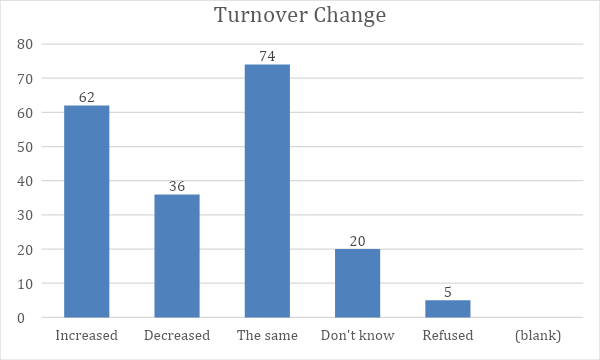
The assessment of businesses revealed that the turnover of the majority of businesses (37.6%) stayed the same in comparison with last year. Another 31.5% of respondents claimed that the turnover of their business increased. The distribution of answers in terms of turnover change is presented in Figure 5 below.
The current distribution of businesses in the region by turnover is presented in Table 1 below. According to the presented information, more than 21% of businesses had a turnover of more than £1 million, while almost 18% of entrepreneurs were unaware of the turnover rate of their businesses.
Table 1. Turnover in the South East region
According to self-reported data, the primary concern of business owners in the past three years was growth in 47.3% of cases and survival in 37.8% of cases. The distribution of answers about the central objective of the businesses is presented in Table 2 below.
Table 2. Primary objective during the last three years South East region
However, entrepreneurs are optimistic about the development of their businesses. The analysis demonstrates that almost 65% of respondents believe that the central objective of their business during the next three years will be growth, and only 23% think they will be concerned with survival. However, it is worth mentioning that 3.15% of entrepreneurs plan to sell their business and 1.8% plan for closure. The distribution of answers on the topic is presented in Table 3 below.
Table 3. Primary objective during the next three years South East region
North West Region
The analysis of the North West region’s business health was based on the data acquired from 149 respondents aged between 19 and 72. Age distribution of the participants followed the normal distribution pattern with the mean of 45 and SD of 12, which is similar to the mean and SD of the entire sample. The mean business experience of the respondents (26.5 years) was somewhat higher than the mean experience across all regions (19.2 years). However, the difference is not critical and should affect the overall business health of the region. The distribution of the sample by business experience is presented in Figure 6 below. Approximately 80% of respondents were from urban areas, and 20% were from rural areas.

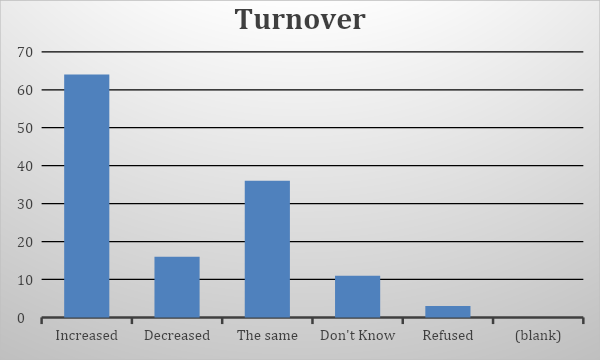
Last year, the majority of businesses in the region (49%) experienced an increase in turnover, while 28% of respondents declared no significant change in revenues. The distribution of replies concerning changes in turnover is presented in Figure 7 below.
The current distribution of businesses in the North West region by turnover is presented in Table 4 below. According to the presented information, more than 21% of businesses had a turnover of more than £1 million. Almost one-fifth of all businesses had turnover between £100,000 and £249,999.
Table 4. Turnover in North West Region
During the past three years, 48% of respondents viewed growth as their primary objective, while 36.2% were primarily concerned with survival. The detailed information about the distribution of answers concerning the primary objective during the past three years is presented in Table 5 below.
Table 5. The primary objective during the last three years North West region
Two-thirds of entrepreneurs believe that the primary objective of their business in the following three years will be growth, while 18% will be concerned about survival. At the same time, only 2% of respondents are planning to sell their business, and no one plans to close their business. The distribution of answers on the topic is presented in Table 6 below.
Table 6. The primary objective during the next three years North West region
Comparison of Regions
The sample characteristics of both South East and North West regions were adequate to draw conclusions about the population. Even though the sample size differed between the two regions, it was sufficient to make generalizations in both cases. There were no significant differences in means and standard deviation of the respondents’ age between the regions and compared to the age distribution of the entire sample. Area representation (rural against urban) in both regions did not differ from the distribution by area of the sample of all nine regions. Thus, it may be concluded that the demographics of entrepreneurs do not differ considerably in North West and South East regions.
Business owners in both regions had similar objectives during the past three years. Almost half of all entrepreneurs in the South East and North West regions declared growth as their primary objective in the past. At the same time, around 36%-39% of respondents from both regions believed that survival was the primary concern.
The respondents in both regions were equally optimistic about the development of their business in the future. Approximately two-thirds of respondents from both regions believed that in the coming three years, their primary objective would be growth. However, more entrepreneurs in the South East region (23%) thought they would have survival as their primary concern in comparison with the North West region (18%). At the same time, 2% of respondents expected to close their business, and another 3% wanted to sell their business in the next three years in the South East region. In North West, the participants did not report having intentions to close the business, and only 2% of the respondents planned to sell their business. Thus, the situation in the North West region seems to be more favorable for business development than in the South East based on this variable.
The analysis of changes in turnover supports the idea that business is healthier in the North West region in comparison with the South East region. In the North West, almost half of the respondents claimed that their turnover increased during the past 12 months. In the South East, however, only 31.5% reported an increase in revenues. Additionally, only 12% of respondents reported a decrease in turnover in North West, while in the South East the percentage of such businesses was above 18%. This finding demonstrates that North West provides more opportunities for businesses to develop.
Such an environment attracts small businesses and young entrepreneurs in North West. The analysis demonstrates that 21% of businesses in the North West region have a turnover of less than £100,000 a year. At the same time, only 16% of business owners reported a turnover of less than £100,000 in the last year. The mean business experience of participants from the North West (26.5) region is considerably lower than that of entrepreneurs from the South East (34.5). However, the mean level of experience of entrepreneurs in the North West is higher than the average experience level of business owners across all nine regions.
In summary, it may be stated that the North West region is healthier in terms of business development in comparison with the South East region. This is confirmed by the expected objective for the next three years, the experience of entrepreneurs, and estimated turnover.
Conclusion
The findings suggest that the majority of entrepreneurs from both regions expect their business to grow in the next three years. Therefore, the government should provide informational support for efficient growth practices for both regions. At the same time, survival seems to be a significant concern for both regions; thus, supportive services in both regions need to offer relevant information about survival strategies.
The evidence suggests that North West has a more favorable environment for business growth. However, further research is needed to understand the reasons for the matter. The BIS dataset used for the present report provides additional information about the business environment in both regions. The data can be used to determine the reasons for the phenomenon and improve the current situation in the South East region.
The government needs to create incentives for smaller businesses to develop in the South East. This can be done by decreasing taxes, educating the entrepreneurs, and granting free analytic services for small businesses. Such initiatives may attract new investments in the region that will create a new generation of young entrepreneurs.