Introduction
Background to the study
The data given in this paper is raw data that has been summarized and organized following research that was most likely intended to study the individual components of solid waste. What is therefore represented by this data are figures of certain variables that the research intended to focus on during the research study which was the composition of solid waste is in the areas studied. The summarized data of this study is named “Sampling Segregation at Source; Composition of Recyclables Delivered (Green Bin)”. Going by this title of the data we can be able to infer most of the background information of the study; for instance, we can tell based on this information that the data obtained was from a sampling study of a larger population. What this means is that the characteristics of solid wastes that were eventually analyzed in this study were randomly picked from a population of many “green bins” which have been identified for this particular study.
This basically involved use of random sampling techniques; random sampling is a sampling technique that relies on a simple probability method of choosing desired sample size by random selection method (Mugo, 2010). Ideally, simple random sampling involves assigning all cases of the population with numbers; once this is done the required study cases are then determined (Gilgun, Daly and Handel, 1997). The study population will be the sample size which is randomly picked by selecting cases from a list of numbers that were assigned to the population and then matching these selected numbers to specific cases that would make up the sample population that is actually studied (Newman, 1994).
This also tells us that the data obtained for this study which has been summarized is a true representation of the general population characteristics that are being studied in this case. For the purposes of this study, the data obtained were analyzed based on two major variables; its weight and the nature of the waste itself. The weight variable is especially necessary as this study entailed the determination of the proportion of waste that is recyclable in the context of all the other waste that is aggregated and collected in the green bin from the source. In fact, the main objective of this research study appears to have been to identify the percentage of recyclable wastes that are contained in the solid waste that is collected from the source. By determining the percentage proportion of recyclable waste that is present in the green bin used to collect the solid wastes, the researchers can infer the proportion of recyclable waste that is present in the solid wastes collected from a specific region.
Secondly, the objective of the study was to determine the actual and various types of solid waste composition that is present in the solid waste collected from the identified source. The importance of this analysis is that determination of the actual proportion of each element in the solid waste collected is necessary to give an insight into the nature and percentage of the recyclable waste that is present in the total waste collected for various possible reasons that we shall be discussing later in this paper. Finally, the data collected for this study were collected across two localities which are indicated as MA and FH over a period of one week (7 days), between 22nd February this year and 28th February.
Methodology
Study variables
We have already determined the two major factors that were used in analyzing the components of the solid waste collected in the two areas in the green bin; in this section, we shall briefly discuss the various variables that the study used in summarizing the data obtained. There are six variables used in summarizing the data for this research study; that is the source area from where the waste is collected from indicated as MA and FH, the total aggregate weight of the sample, date of collection, the proportional composition of the waste in the particular green bin disaggregated into five types, percentage proportion of recyclable waste and percentage of contaminants present in the bin samples. It is based on these variables that the data obtained from the study have been summarized, organized, and analyzed.
Study design
Foremost, we can determine that the nature of this research study was qualitative in nature because of the characteristic of the data that was collected which we can see to be mainly numerical in nature. It also appears that a questionnaire was used in this data collection since it is the most appropriate method of data collection considering the nature of the study. A questionnaire is the most commonly used instrument in the collection of quantitative and qualitative data from a sample population (Marshal and Rossman, 2002). It is the most suitable method of data collection of numerical nature and limited subjective data since the forms can be designed in such a manner that will ease the data entry and its organization.
In this case, the questionnaires were used in recording the variables of interest of sampled green bins that were being studied by the research, the results of which were later entered and summarized in the excel file.
The data analysis for this research study was done by use of quantitative techniques; quantitative because it involved the Operationalization of numerical data. It is also qualitative because the resulting numerical data organized and refined would further be discussed and inferences made on them in the next step. Because there was no qualitative data collected, the only data analysis required was quantitative, which was analyzed using Minitab statistical program (Silver, 1993). Once the data has been organized and analyzed it became easy to perform various statistical tests on it to determine the validity of research questions that the research was investigating; in this case, there was null hypothesis (Ho) and alternative hypothesis (HA); the null hypothesis, was (Ho) “% of contaminants in green bin = 60% vs. > 60”.
An example of a relevant statistical test done on this research dataset was the Anderson-Darling Normality Test; this is a test that is used in determining the variability of a dataset from the normality. In other words what the test does is determine if a given dataset is normally distributed or otherwise, this can be determined by interpretation of the P-value and other functions that are generated by the test. Based on statistical rules P-value, in this case, will determine the normality of the data distribution; when the P-value for instance is (less than or equal to) > 0.05 then the data is not normally distributed while a P-value of more than 0.05 indicates that the normality test had been certified (Nye and Null, 2001). Skewness is another function that is provided by the Anderson-Darling Normality Test, in this case, it is used to determine the proportion of data that is below average (Nye and Null, 2001).
Variance and Standard Deviation were also been used to measure the variability of the given dataset i.e. how widely the data is dispersed (Kelle, 1980); the variance and standard deviation are related in that the standard deviation is the square root of the variance (Kelle, 1980). Finally, the kurtosis function is used in statistics to indicate the nature of tails in normally distributed data, this is necessary for approximation of how the data distribution has been patterned.
Besides this, the data has been analyzed using boxplot graphical analysis of contamination levels of the sampled green bins where the null hypothesis is pegged at 95% confidence. The boxplot is especially relevant as it graphically and neatly highlights three variables of a given dataset; that is the median, locations of extreme quartiles, and minimum and maximum figures in the dataset (Kelle, 1980). In this case, the use of boxplot is especially necessary as it is also used in highlighting the variability of the data, its distribution and normality which is important in the determination of the skewness in the dataset as well as identification of outliers. The actual analysis of the statistical and their interpretations will be done in the following section of the data analysis discussion.
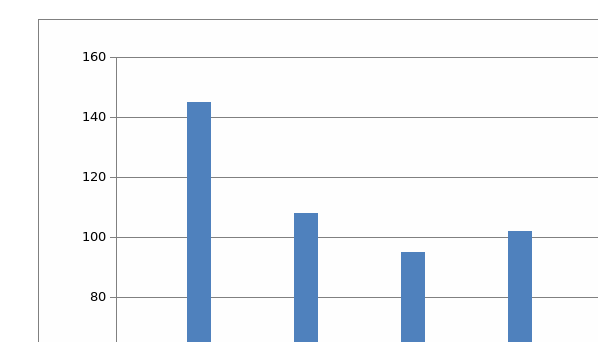
The following graphs represent the summarized data of the solid waste composition of the two localities that were studied by this research study and depict the trends of the three major variables that the study was most interested in analyzing, namely; a total weight of the waste, percentage of recyclable waste present and finally the proportion of contaminants.

Results
In this section of the paper the data analysis that we shall be undertaking shall be mostly qualitative in nature since the interpretation of the data is going to be mainly subjective in nature. Throughout this section of the paper the data that will mostly be analyzed is the proportion of the contaminant present in the waste since this is the main variable of the study that has been analyzed by the Minitab statistical programme. Foremost, a general overview of the data indicates that the research study was undertaken over a period of 7 days in two localities that have been coded as MA and FH; during this time there are interesting results that can be inferred from the data set. One, the total weight of solid waste that was being collected during the indicated period is seen to have gradually been decreasing from a high of 146.5 kgs to 88 kgs in in Al-Masoodi locality while the Falaj Hazza locality indicates the results of three days only that also gradually reduced from a high of 232 kgs to 145 kgs. It is impossible to infer what might have exactly led to consistently less solid waste being collected each day of the study which represents a difference of as much as 80kg. One probable reason could be that as the study kicked off the total number of solid waste that was collected in day one could have been an accumulation of several days earlier but which gradually reduced as each day went by and waste was collected from the households, but there could also be other reasons
In addition to this observation, the data indicates varying proportion of recyclable materials and contaminants in the solid waste sampled that are seen to vary according to the total weight of waste sampled. What this indicates is that the percentage of the two variables of interest being studied, that is contaminants and recyclable materials are dependent on the final weight of dustbin sampled. Another observable characteristics of the data results is that the proportion of contaminants in the sampled green bin were consistently high throughout the study and was as much as 80% and rarely reduced below 60%.
This characteristic of the solid waste is understandable when you consider that the solid waste that was being sampled for this research study was mainly obtained from household which we expect to generate more organic waste and less recyclable materials. It is for the same reason that we have consistently less proportion of recyclable materials in the sampled waste throughout the duration of the study. Another noticeable feature of the dataset is the trend of composition of the recyclables obtained from the waste; among the nine different types of recyclables that were being sorted during this study, it is clear that highest proportion of recyclables was made up of “mixed carton” followed by “carton”, “PET” and then the rest, the least of which is aluminum.
In fact, the results of the data indicate that there were not any paper recyclable materials that were sorted from the sampled waste throughout the duration of the study. This possibly means that the packaging materials that are commonly used in the areas sampled do not include paper, perhaps because of government regulations or other similar policies that might have been enacted to regulate use of paper in the two areas. It could also mean that the paper recyclable materials that were obtained from the sampled solid waste could not be recycled, probably because they had already been contaminated by the moisture of the organic contaminants rendering their recyclability useless.
Now that we have analyzed the data in general, let us now undertake a detailed interpretation of the figures obtained from the statistical test that was done on the dataset which were specifically aimed at determining the contaminants percentage present in the sampled green bins. As mentioned previously, the Anderson-Darling Normality Test is used in determining the variability of dataset from the normality, a critical evaluation of its various functions indicates the following. One, that the P-value which is one of the most relevant functions generated by this function is given as 0.230; this would mean that the dataset analyzed is up to a point normally distributed because statistically a P-value of above 0.05 implies that the given data conforms to normal distribution.
What this implies is that the sample dataset is to an extent evenly distributed throughout the study duration; this characteristic of the data enables important inference to be done on the data especially as relates to the general characteristic of the population from which the samples have been obtained. The other important function generated by the data analysis is the skewness which is indicated as, 0.52; what this means is that the dataset is positively skewed and a significant proportion of it is below the mean figure of the data. This is because for a dataset that is not skewed and which is normally distributed, then the skewness is always zero. Besides this, there is the kurtosis which is indicated as -0.71; since the kurtosis in this case is negative the implication is that the tails of the graphical represented data is much lighter than what would be expected in a normally distributed dataset.
The boxplot portrays similar characteristics of the dataset but in a different way; for one it depicts the position of the median and highlights the range that the upper and lower quartiles of data falls. Based on this boxplot, we can tell that the median of the dataset is largely aligned towards the lower quartile of the data as opposed to the upper quartile and has a minimum of 60% and a maximum of 80%. We can also tell that the lower and upper quartiles of the contaminant data represented are not in proportion to each other because they are not of the same size; the data in the lower quartile are more than the data in the higher quartile.
Conclusion
Therefore having discussed the various characteristics of the dataset indicated as summarized above we can infer the following. Foremost, that the major component of solid waste obtained from the two localities was mostly composed of contaminants with only few composition of recyclable waste that was not above 40%. Because, the solid waste analysis done on the sample green bins was a representation of the general waste collected from the two areas then we can postulate that the nature of solid waste collected from the two areas will more than often be comprised of a huge proportion of contaminant waste rather than recyclable waste. Secondly we can expect the actual composition of the recyclable waste being recovered from the sampled green bins not to change which would mean that mixed carton shall probably continue to be the major recyclable material that is obtained from the solid waste collected from the two localities. Finally, since the null hypothesis has been certified to be true within a 95% confidence interval, we now know that the probability of percentage contaminants being 60% or more to be more likely and probable 95% of the time. This fact is consistent with the data which indicates that for all the sampled green bins the contaminants proportion were highest all the time and each time comprised of not less than 60% of the total weight of the waste.
References
Gilgun, K., Daly, S. & Handel, G. (1997). Qualitative Methods in Family Research. London; Sage Publications.
Kelle, U. (1980). Computer Aided Qualitative Data Analysis: Theory Methods and Practice. London; Sage Publications.
Marshal, C. & Rossman, G. (2002). Designing Qualitative Research. Carlifornia; Newbury Park.
Mugo, F. (2010). Sampling in Research.
Newman, L. (1994). Social Research Methods. Boston; Allys & Bacons.
Nye, H. & Null, H. (2001). SPSS Statistical Package for the Social Sciences. Boston; Brown & Company.
Silver, D. (1993). Interpreting Qualitative Data. London; Sage Publications.