Correlation and T-Test in Psychological Statistics

Correlation Test

To establish the nature of correlation that exists between mindfulness and two forms of happiness, namely, subjective happiness and Oxford happiness, Spearman’s correlation test was used. According to Coolican (2014), Spearman’s correlation test is suitable in the analysis of ordinal data because it is a nonparametric test, which assesses the extent of dependence between two variables. Since Spearman’s correlation test ranks measurements before analysing their dependence, it gives an accurate correlation of nonparametric data. As scales, such as subjective happiness scale, mindfulness scale, and Oxford happiness scale, collect data in ordinal form, Spearman’s correlation test is appropriate in analysing their dependence. The Spearman’s correlation test gives a correlation coefficient, which is a value that ranges from -1 to +1. The correlation coefficient gives the nature of dependence or relationship that exists between two variables.

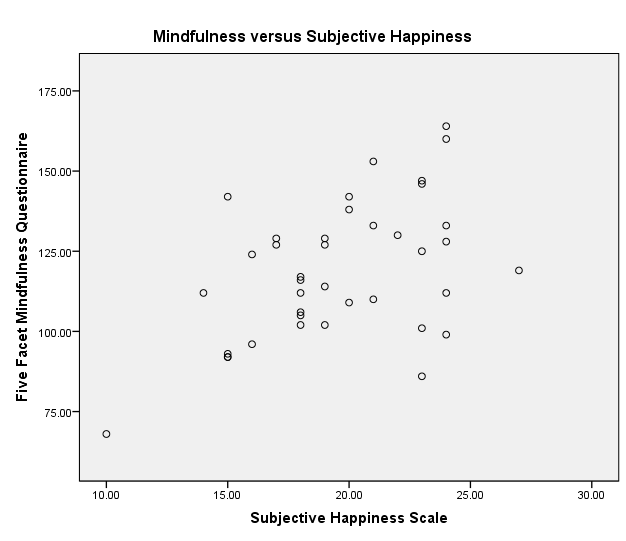
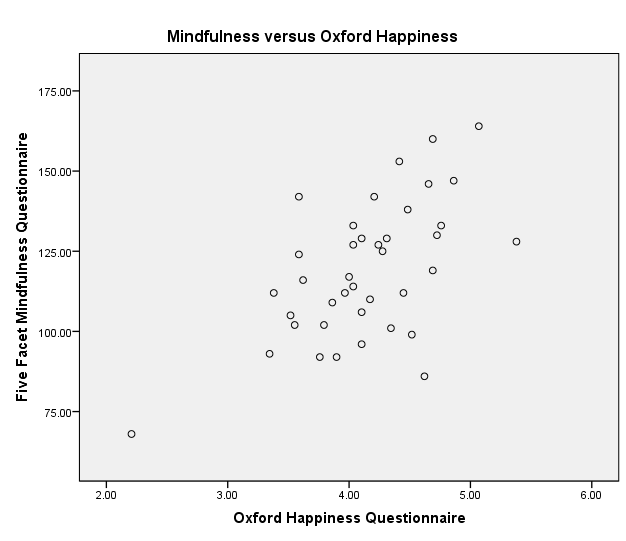
The hypothesis of the study is that mindfulness has significant positive correlation with subjective happiness and Oxford happiness. The test of the hypothesis using Spearman’s correlation, one-tailed test, indicates that mindfulness has significant positive correlation with subjective happiness, (rs = 0.472, p = 0.001) and Oxford happiness, (rs = 0.590, p = 0.000). The positive correlation between mindfulness and subjective happiness is moderate, whereas the positive correlation between mindfulness and Oxford happiness is very strong. Analysis of correlation coefficients reveals that mindfulness correlates more with Oxford happiness than subjective happiness. However, since the p-values are less than 0.05, the correlation tests show that mindfulness has significant positive correlation with subjective happiness and Oxford happiness.

Data Analysis: Spearman’s Correlation

Correlation between Mindfulness and Subjective Happiness

Correlations
Five Facet Mindfulness Questionnaire Subjective Happiness Scale
Five Facet Mindfulness Questionnaire Pearson Correlation 1 .472
Sig. (1-tailed) .001
N 39 39
Subjective Happiness Scale Pearson Correlation .472 1
Sig. (1-tailed) .001
N 39 39

Correlation between Mindfulness and Oxford Happiness

Correlations
Five Facet Mindfulness Questionnaire Oxford Happiness Questionnaire
Five Facet Mindfulness Questionnaire Pearson Correlation 1 .590
Sig. (1-tailed) .000
N 39 39
Oxford Happiness Questionnaire Pearson Correlation .590 1
Sig. (1-tailed) .000
N 39 39

Scatter Diagrams

Mindfulness and Subjective Happiness
Mindfulness and Oxford Happiness

Descriptive Statistics

Descriptives
Statistic Std. Error
Oxford Happiness Questionnaire Mean 4.1370 .09123
95% Confidence Interval for Mean Lower Bound 3.9524
Upper Bound 4.3217
5% Trimmed Mean 4.1529
Median 4.1034
Variance .325
Std. Deviation .56972
Minimum 2.21
Maximum 5.38
Range 3.17
Interquartile Range .72
Skewness -.730 .378
Kurtosis 2.369 .741
Five Facet Mindfulness Questionnaire Mean 118.9744 3.40308
95% Confidence Interval for Mean Lower Bound 112.0852
Upper Bound 125.8635
5% Trimmed Mean 118.9259
Median 117.0000
Variance 451.657
Std. Deviation 21.25223
Minimum 68.00
Maximum 164.00
Range 96.00
Interquartile Range 31.00
Skewness .044 .378
Kurtosis -.155 .741
Subjective Happiness Scale Mean 19.6154 .58388
95% Confidence Interval for Mean Lower Bound 18.4334
Upper Bound 20.7974
5% Trimmed Mean 19.7123
Median 19.0000
Variance 13.296
Std. Deviation 3.64631
Minimum 10.00
Maximum 27.00
Range 17.00
Interquartile Range 6.00
Skewness -.281 .378
Kurtosis -.162 .741

T Tests Repeated Measure Design. Analyse Comparing Means, Head Samples as Same People Generated

Given that the blindness study consists of four related measurements, the appropriate form of test statistic, which can analyse collected data, is paired-samples t-test. The four related measurements provide different pairs of data, which paired-samples t-test can analyse by comparing means. Weinberg and Abramowitz (2008) state that paired-samples t-test is suitable in comparing the means of two related groups. The related groups in this case are the three pairs of measurements, namely, Q1 and Q2, Q2 and Q3, and Q3 and Q4, which are obtained from the four related measurements in the blind study.

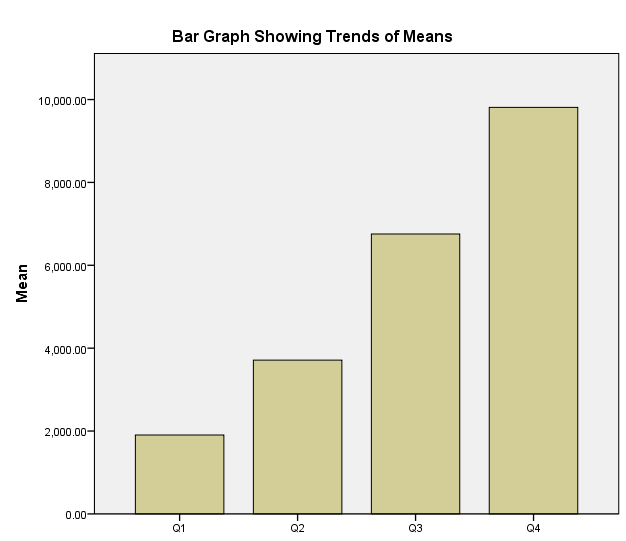
The hypothesis of the blind study is that there are significant differences between means of Q1 and Q2, Q2 and Q3, and Q3 and Q4. The paired-samples t-test indicated that there were significant differences between means of Q1 and Q4 (t(64) = -22.688, p = 0.000), Q2 and Q3 (t(64) = -15.355, p = 0.000), and Q3 and Q4 (t(64) = -13.817, p = 0.000).

Pairs of Measurements

Pair 1: Q1 and Q4

Pair 2: Q2 and Q3

Pair 3: Q3 and Q4

Data Analysis

Paired Samples Test
Paired Differences t df Sig. (2-tailed)
Mean Std. Deviation Std. Error Mean 95% Confidence Interval of the Difference
Lower Upper
Pair 1 Q1 – Q4 -7906.8516 2809.68083 348.49802 -8603.0564 -7210.6467 -22.688 64 .000
Pair 2 Q2 – Q3 -3043.8971 1598.25131 198.23868 -3439.9244 -2647.8698 -15.355 64 .000
Pair 3 Q3 – Q4 -3057.4225 1784.07109 221.28678 -3499.4937 -2615.3514 -13.817 64 .000
Paired Samples Correlations
N Correlation Sig.
Pair 1 Q1 & Q4 65 .758 .000
Pair 2 Q2 & Q3 65 .796 .000
Pair 3 Q3 & Q4 65 .831 .000
Recommended Bar Graph
Excel Bar Graph with Error Bars

References

Coolican, H. (2014). Research Methods and Statistics in Psychology. New York: Psychology Press.

Weinberg, S., & Abramowitz, S. (2008). Statistics using SPSS: an integrative approach. New York: Cambridge University Press.

Cite this paper

Select style

Reference

StudyCorgi. (2020, August 25). Correlation and T-Test in Psychological Statistics. https://studycorgi.com/correlation-and-t-test-in-psychological-statistics/

Work Cited

"Correlation and T-Test in Psychological Statistics." StudyCorgi, 25 Aug. 2020, studycorgi.com/correlation-and-t-test-in-psychological-statistics/.

* Hyperlink the URL after pasting it to your document

References

StudyCorgi. (2020) 'Correlation and T-Test in Psychological Statistics'. 25 August.

1. StudyCorgi. "Correlation and T-Test in Psychological Statistics." August 25, 2020. https://studycorgi.com/correlation-and-t-test-in-psychological-statistics/.


Bibliography


StudyCorgi. "Correlation and T-Test in Psychological Statistics." August 25, 2020. https://studycorgi.com/correlation-and-t-test-in-psychological-statistics/.

References

StudyCorgi. 2020. "Correlation and T-Test in Psychological Statistics." August 25, 2020. https://studycorgi.com/correlation-and-t-test-in-psychological-statistics/.

This paper, “Correlation and T-Test in Psychological Statistics”, was written and voluntary submitted to our free essay database by a straight-A student. Please ensure you properly reference the paper if you're using it to write your assignment.

Before publication, the StudyCorgi editorial team proofread and checked the paper to make sure it meets the highest standards in terms of grammar, punctuation, style, fact accuracy, copyright issues, and inclusive language. Last updated: .

If you are the author of this paper and no longer wish to have it published on StudyCorgi, request the removal. Please use the “Donate your paper” form to submit an essay.