Role of Statistics in Psychological Research
Data gathering comes along with the need to describe, summarize, and interpret it. For instance, in psychological research, statistics connect a research idea and useful conclusions (Fosters et al., 2018). Statistical tools and techniques aid the organization of data into a more interpretable form, saving time and money for psychological researchers. Psychology researchers also used statistics to: derive test statistics, unleash the connection between variables, and extract factors. For example, in understanding and appreciating personality and its development. Therefore, statistics are used by psychological investigators to create meaningful information from raw data gathered from the research.
Discriminating Between Descriptive Statistics
Statistics is broadly divided into descriptive and inferential statistics, and a distinction can be drawn between them. Descriptive statistics concentrate on describing and summarizing data sets using insightful metrics such as measures of dispersion or variability and central tendency (Vanlalhriati & Singh, 2015). Measures of central tendency focus on the central location of the dataset and serve to abridge dataset using single variables such as mean, median, and mode. The measures of dispersion show the reliability of measures of central tendency by showing how far a single data point is from dataset’s center, and such measures include range, mean deviation, variance, and more. In contrast, inferential statistics are techniques utilized in making population-based inferences from the outcome of sample analysis (Van Elst, 2019). Typical examples of inferential statistics include a test for hypotheses and nonparametric tests. The summary of descriptive statistics is shown in Table 1 and possible graphs drawn from the dataset are in figures 1, 2,3, and 4.
Comparing Different Levels of Measurement
Measurement scales include ratio, interval, ordinal, and nominal, and they have hierarchical order. Nominal scale is a mere categorization represented as names or labels and used for variables such as gender, and political party affiliation. Ordinal scale indicates the rank order, specifically when showing the time of the day or attitude (Foster et al., 2018). An interval scale is a special type of ordinal scale because it considers difference between values as meaningful. The measures of central tendency such as median and mode are classified under the interval scale. Ratio scale is a quantitative scale characterized by the presence of true zero besides the existence of an equal interval between two neighboring points. Interval scales are used mostly for the measurement of length and time. Nominal scale is the most inferior type of scale, and as one goes up the hierarchical ladder, these scales become sophisticated. Measures such as variance, mean squared deviation, standard deviation belong to ratio scale category. The top-most complex form of scale is a ratio scale, followed by an interval, ordinal scale, and nominal scale (Allanson & Notar, 2020).
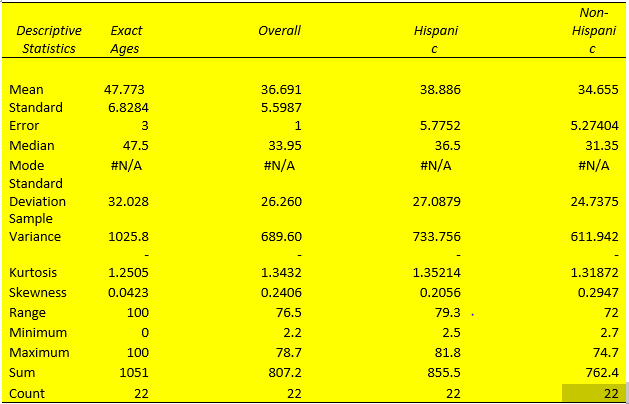
Table 1: Summary of Descriptive Statistics
Interpretation of Descriptive Statistics
The mean and median for each dataset column almost lie at the same point. For example, considering the exact ages column, the mean and median are 47.773 and 47.5, respectively. This means that the dataset approximates a normal distribution (Fosters et al., 2018). Similarly, the existence of a large standard deviation implies that data points are far off the central point. Moreover, the absence of mode for each column of the dataset indicates that it is an outlier variable.
Probability and an Introduction to Hypothesis Testing
Z-score Calculation
The Z-score is important, particularly when comparing the relative standings of points, where mean and standard deviation are different, and its seldomly used when dataset forms a normal distribution. Suppose the researcher needs to determine the probability that overall life expectancy is greater than 50, it is possible to determine such probability, but the first stage involves finding the Z-score. Z-score (Z) can be calculated using equation (1) below.


Real Life Applications of Probability and Its Role in Statistical Analysis
Probability refers to the chances of obtaining an event among several possibilities. Probability influences the smallest and biggest decisions that guide day-to-day human actions (Richardson, 2016). For example, the researcher can find the probability that the mean overall life expectancy is greater than 50 years in the US. Such probabilities can be figured in various ways, depending on the sophistication and possible quantification of items captured in the situation. The magnitude of probability assists in deciding to reject null hypotheses when conducting analysis using the standard normal distribution. As such, the null hypothesis is only accepted when the probability (p) value is greater than the level significance, otherwise, it is rejected. For the example provided in the example being considered, hypotheses can be formulated as follows.


Severity of Type 1 and 2 Errors in Relation to Hypothesis Testing
 when it is, in fact, true, while type 2 error is committed by failing to reject


Conditions for Application of Sample z-Test and t-Test, and Interpretation of Test Results
The use of t-statistics or z-statistics relies on the sample size (n). If the size of the sample (n ≥30), then t-statistics is used, otherwise researchers use Z-statistics (Richardson, 2016). Independent sample t-test is a special kind of T-test utilized when an investigator is considering two separate groups (Mishra et al., 2019). For our case, n=22, which is less than 30. Therefore Z-statistics is applicable for the case under consideration, and we will use a confidence level of 0.05. Since P-value (0.5277) is greater than the confidence level (0.05), we deduce that there is an evidence to support that overall mean life expectancy is less than or equal to 50 years at 5% significance level.
ANNOVA Analysis
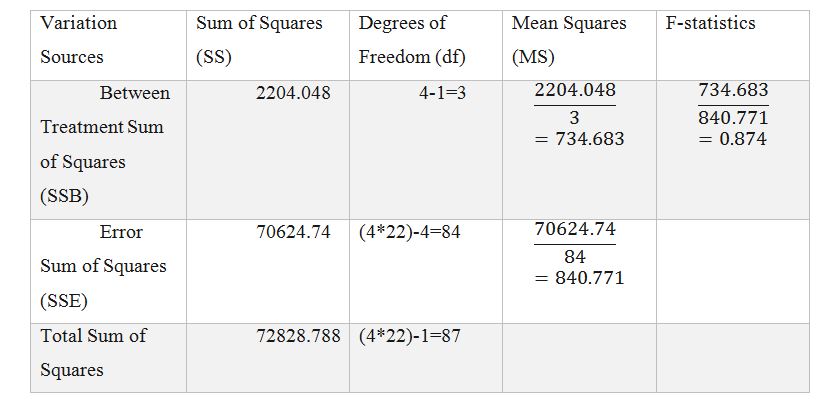
Table 3: ANNOVA Computations
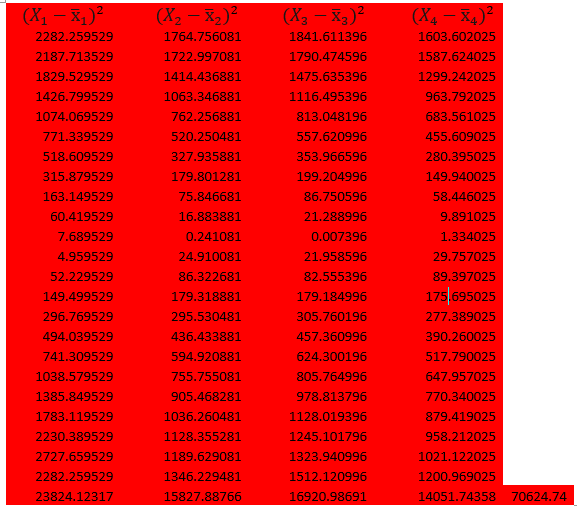
Calculations


Where J=1, 2,3, 4 and N=4
 = 100.184
Table 2: ANNOVA Summary Statistics
![]()
Interpretation of Test Result
Null hypothesis (H0) is accepted when the computed statistics lies within the critical region. We accept H0 because 0.874<2.7132. There is statistically significant evidence at α=0.05 to show a lack of difference in mean life expectancy. ANOVA tests are advantages compared to multiple T-tests. The ANOVA analysis support perfect testing for equality of group means. Also, it is known for controlling the rate of having type I error in hypothesis testing (Wilcox, 2017). Finally, the ANOVA test is powerful if the normality assumption holds.
Regression Analysis
Regression analysis is seldomly applied s in psychological research. Such analysis often uses two keywords: correlation and causation. However, the existence of a correlation between variables does not automatically imply that the change in the first variable is the cause of the change in the second variable. For causation, shifts in one variable stem from dynamics in the other variable (two variables are dependent). When conducting regression analysis, the investigator focuses on theoretical knowledge to classify variables as dependent or independent. There is a relationship between overall life expectancy and individuals’ exact ages from the data set under consideration. Therefore, life expectancy is an independent variable, while exact ages are a dependent variable. The hypotheses can be formulated as follows.


Interpretation of Results and Prediction
![]()
 and conclude that there is a statistical evidence to merit the correlation between the exact ages and the overall life expectancy.


We have:
 =-1.211(75) +92.211= 1.39 years.
Chi-Square Test
Formulation of Hypotheses


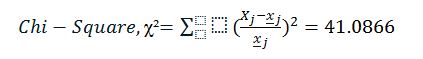
Test Statistics
Table 3: Showing Chi-Square Computation
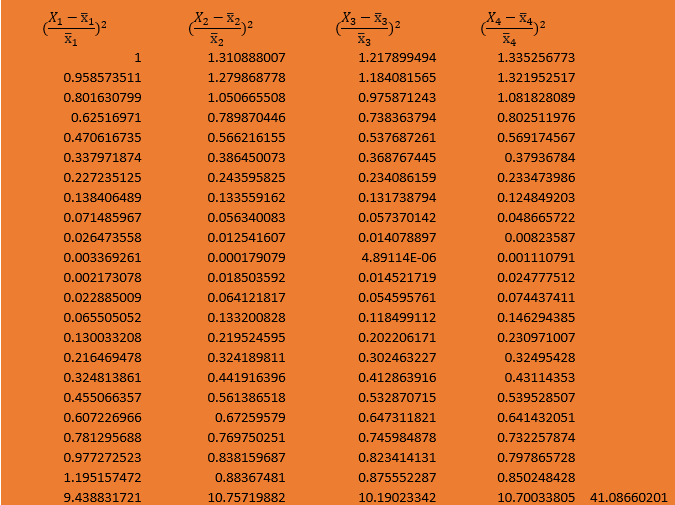
The P-Value is <.00001. The result is significant at p <.05.
Interpretation of Test Result
From the test, P-value is less than the significance level, therefore, a sufficient evidence exists to prove deduce that associating exists between the four columns delineating life expectancy.
References
Allanson, P. E., & Notar, C. E. (2020). Statistics as measurement: 4 scales/Levels of measurement. Education Quarterly Reviews, 3(3). Web.
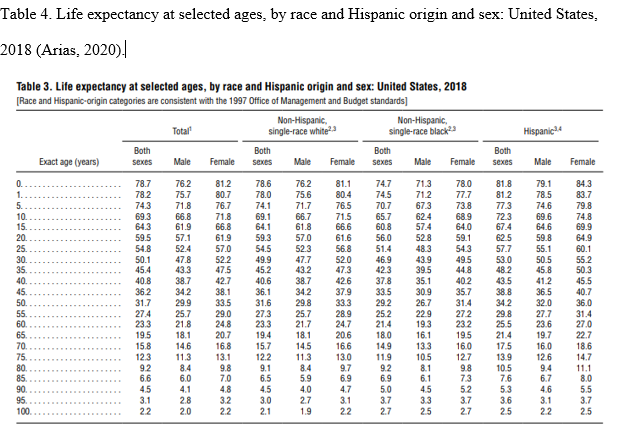
Arias, E. (2020). United States life tables, 2018. National Vital Statistics Reports, 69(12). Web.
Foster, G. C., Lane, D., Scott, D., Hebl, M., Guerra, R., Osherson, D., & Zimmer, H. (2018). An introduction to psychological statistics. Web.
Gohary, T. (2019). Hypothesis testing, type I and type II errors: Expert discussion with didactic clinical scenarios. International Journal of Health and Rehabilitation Sciences (IJHRS), 8(3), 132. Web.
Maravelakis, P. (2019). The use of statistics in social sciences. Journal of Humanities and Applied Social Sciences, 1(2), 87-97. Web.
Matthews, N. L. (2017). Measurement, Levels Of. The International Encyclopedia of Communication Research Methods, 1-7. Web.
Mishra, P., Singh, U., Pandey, C., Mishra, P., & Pandey, G. (2019). Application of student’s t-Test, analysis of variance, and covariance. Annals of Cardiac Anaesthesia, 22(4), 407. Web.
Richardson, E. (2016). Applying Statistics and Probability to Everyday Life. Cavendish Square Publishing, LLC.
Van Elst, H. (2019). Foundations of descriptive and inferential statistics (version 4). Karlsruhe: Karlshochschule International University. doi, 10. Web.
Vanlalhriati, C., & Singh, E. N. (2015). Descriptive Statistics in Business Research. International Journal of Advanced Research, 1409-1415. Web.
Wilcox, R. (2017). One-way Anova. Modern Statistics for the Social and Behavioral Sciences, 341-386. Web.
Appendix