Experiment Description
Introduction
Identifying the flow rates of liquid in a specific environment is a complicated task. However, the adoption of the Venturi Flow Meter contributes to acquiring rather accurate results.
Purpose
The purpose of the experiment is to understand the principles of flow measurement and to learn to apply the essential principles and formulas to a practical task. Additionally, learning to operate the PC equipment to analyze the data retrieved and use the related equipment (the Venturi Flow Meter, the autotransformer, the universal process meter, etc.) can be viewed as the purpose of the experiment.
Major Objectives
- Creating data file entries for further analysis;
- Retrieving the information necessary for the further analysis of the flow rate with the help of the LabView software;
- Analyzing the results acquired in the course of the experiment;
- Locating the flow rate in the experiment in question.
Conclusion
The experiment in question has been carried out successfully and can be considered a graphic example of determining the flow rate with the help of the Venturi Flow Meter tool. The experiment results show that the specified means of measuring the flow rate can be used successfully in the corresponding setting, as it allows for determining both the flow and the average error.
Laboratory Report: Measurement
Nomenclature
- Venturi effect: The effect of a change in the velocity of a fluid caused by the change in the diameter of the tube that it flows through, as stated by1.
- Bernoulli’s principle: The law of physics that states that there is a direct correlation between the pressure and the speed of the flow in liquid2.
- Mass flow rate: The mass of a specific substance that is transferred in a specific time period3.
- Volumetric flow rate: The volume of a specific substance that is transferred in a specific time period4.
- Linearity error: The error that helps define the transfer characteristics of a particular process5.
- Hysteresis: The means of defining the outcome of possible losses6.
- Bias error: The error that occurs on a systematic basis5.
Introduction
Locating flow rates in pipes is often a necessity in not only academics but also the industrial environment. The identification of flow rates can be carried out with the help of tools such as the Venturi Flow Meter.
The evaluation of the flow rate is carried out based on Bernoulli’s principle, which states that the changes in the velocity of liquid occur once the diameter of the tube that it flows through is changed, and that velocity is inverse proportion to the diameter of the opening and, therefore, in direct proportion to the pressure that is applied to the liquid in question1.
Experimental Setup and Procedure
The experiment involved the location of the data that was made available to the participants as the experiment commenced, and the fluid started circulating the tube of the vacuum cleaner. The information displayed on the panel of the Venturi Flow Meter, the Universal Process Meter, the analog pressure gauges, and the differential pressure transducer were recorded carefully and entered into the corresponding fields of the LabVIEW Management file in the program.
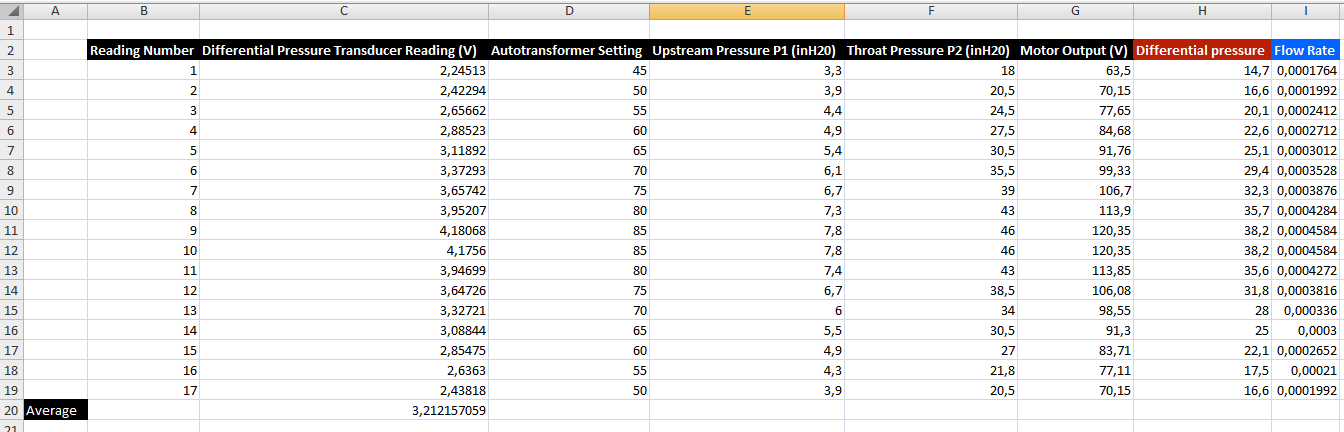
Afterward, the file was renamed, and the measurement of the pressure in the other section was carried out so that the comparison could be conducted. After the key information was retrieved, the differential pressures have been calculated. As the information represented in table shows, the measurement was carried out 17 times.
Results and Discussion
As the chart above shows, the differential pressure tends to be in direct proportion to the pressure transducer output.
According to the formula, the flow rate can be calculated according to the following formula:
where Cv is the Venturi coefficient, A1 and A2 are the areas of the pipe cross-section, ΔP is the difference between the pressure in A1 and A2, and ρair us the density of air. Based on the conditions of the experiment, Cv equals 0.8159. The density of air is defined in the task as 0.00238 slugs/ft3; a slug, in its turn, equals one lbf*s/ft. Seeing that a slug equals to roughly 14.59 kg and one foot is 0.3048 m, translating the specified units in the SI ones (1 lbf = 0.45 kg and 1 ft = 0.3048 m), one will retrieve the following results: ρair =
The areas of the corresponding sections of the tube can be calculated based on their diameters; as the conditions of the task show, d1 = 0.625’’, which is roughly 1.6 cm, or 0.0016 m, while d2 is 1.315’’, i.e., 3.34 cm, or 0.0034 m. The areas, in their turn, can be calculated with the help of the following formula:

Therefore, the relation of the squared areas in question can be defined as
The correlation between the diameters of the first and the second areas, therefore, equals
Therefore, the formula can be transformed to
Applying the specified formula to the experiment outcomes, one will be able to see that the flow rate was altered significantly with the alterations in the motor output. In other words, the experiment shows clearly that the pressure in a specific area of the tube is in inverse proportion to the area of the tube that the liquid flows through. Particularly, the graph provided below displays that the relation between the flow rate and the differential pressure in a specific section of the tube can be described with the help of the y=ax formula, where y is the flow rate, x is the differential pressure and a is the coefficient based on the data such as the density of the liquid, the Venturi coefficient, the areas of the tube orifices, etc.
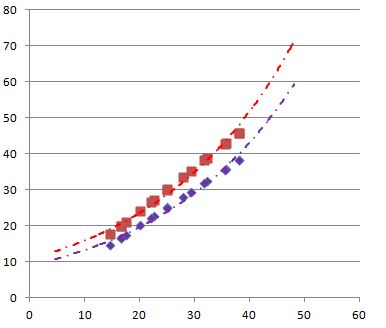
The chart provided above displays rather graphically that the flow rate of the water in the tube is in direct proportion to the differential pressure. In other words, it can be concluded that the experiment carried out with the help of the LabVIEW Measurement system displays that there is a direct relation between the flow rates of fluid (water in the specified experiment) and the changes in the area that it is released through, as well as the alterations in the pressure.
The sensitivity of the pressure transducer varied from 2.2 to 4.1, the average being 3.21. Seeing that the changes, which occurred in the differential pressure transducer reading, can be characterized as exponential (See Fig. 3), it can be assumed that the response can be classified as exponential as well. It is quite remarkable that no basic bias errors have occurred during the experiment.
However, the specified method works primarily for calculating the volumetric flow rate. In case the mass flow rate needed to be calculated, the factor such as the mass of the fluid that passed through the tube would have to be taken into account. In this case, the temperature of the water would matter significantly, as it might affect the density of the water.
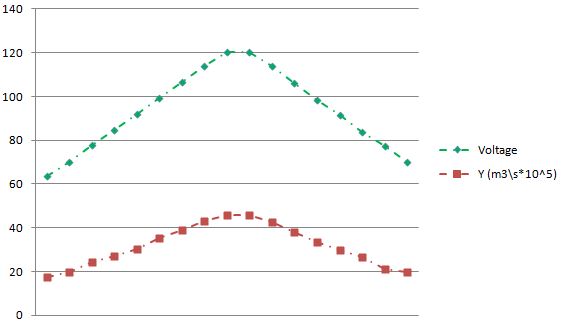
According to the chart below, the voltage across the motor is in direct proportion to the flow rate of the water. The specified phenomenon can be explained by the fact that the motor enhances the process of water flow by increasing its speed. Therefore, it can be assumed that there is a strong correlation between the voltage of the device used for enhancing the flow process and the volumetric flow rates in the specified environment.
While flow obstruction meters can be deemed as fairly efficient tools for assessing the flow rate, other devices should also be taken into account when designing an experiment. Particularly, tools such as orifice plates and flow nozzles deserve to be mentioned.
Summary and Conclusion
The experiment shows quite clearly that the flow of liquid can be calculated in a rather precise manner with the help of the Venturi Flow Meter based on Bernoulli’s principle. Despite the fact that there may have been certain discrepancies in the calculation process due to the approximation of the results, the changes in the pressure and, therefore, the flow of the water in the tube has been identified. The experiment has proven that Bernoulli’s principle works in the specified environment and that the flow rate of water is in inverse proportion to the diameter of the tube.
References
- Hendrics, M. Introduction to Physical Hydrology, OUP, Oxford, UK.
- Ostdiek, V., and Bord, D., Inquiry into Physics, Cengage Learning, Boston, MA.
- Cunningham, M. A. Neoclassical Physics, Springer, New York City, NY.
- Moaveni, S. Engineering Fundamentals: An Introduction to Engineering, SI Edition, Cengage Learning, Boston, MA.
- Demler, M. J. High-Speed Analog-to-Digital Conversion, Elsevier, London, UK.
- Singh, N. K. Using Event-B for Critical Device Software Systems, Springer Science & Business Media, New York City, NY.