Purpose and Method
The purpose of data analysis was to identify factors that affect the level of customer satisfaction of McDonald’s. In order to achieve the purpose, a survey consisting of 20 questions was conducted. The acquired data were analyzed using descriptive statistics and regression analysis. First, the analysis of frequencies was used to understand what the customers liked about McDonald’s and what were the major problems. Additionally, frequency tables were used to identify if the availability of healthy dining options and commitment to social responsibility were important to the customers. Second, regression analysis was used to identify if friendly staff and availability of healthy dining options had a significant impact on the level of satisfaction after controlling for age and gender. A total of nine variables were used to conduct the analysis.
Sampling Method and Characteristics
The sample utilized for the present study included 66 clients of McDonald’s in UAE aged 18 and older, 20 of which were females and 44 were males. A simple random sampling method was used, as it was decided to be the most appropriate for the diverse population of McDonald’s customers. According to Mellinger and Hanson (2016), simple random sampling is free from sampling biases, as each person in the population has an equal chance of being selected. The primary inclusion criteria were that the participants utilized the services of the company under analysis during the past six months and were aged 18 and older.
Descriptive Statistics
Frequencies
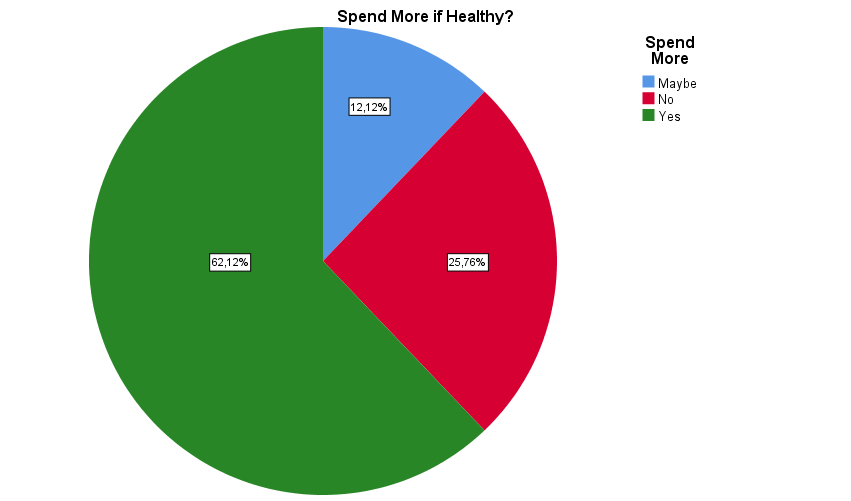
The analysis of frequencies was used to answer four separate questions. First, the frequency of answer to the question “If fast food was healthy, would you be willing to spend more money?” This question aimed at assessing how important was the availability of healthy food options for the customers. The results of the analysis are provided in Figure 1 below.
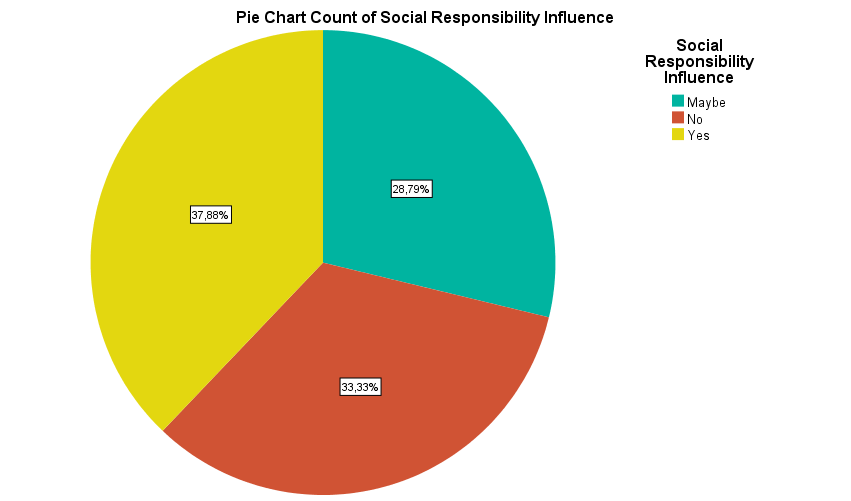
Second, the frequency of responses to the question “Do McDonald’s Corporate Social Responsibility and sustainable development practices influence your purchasing decision?” The results of the analysis are captured in Figure 2 below.
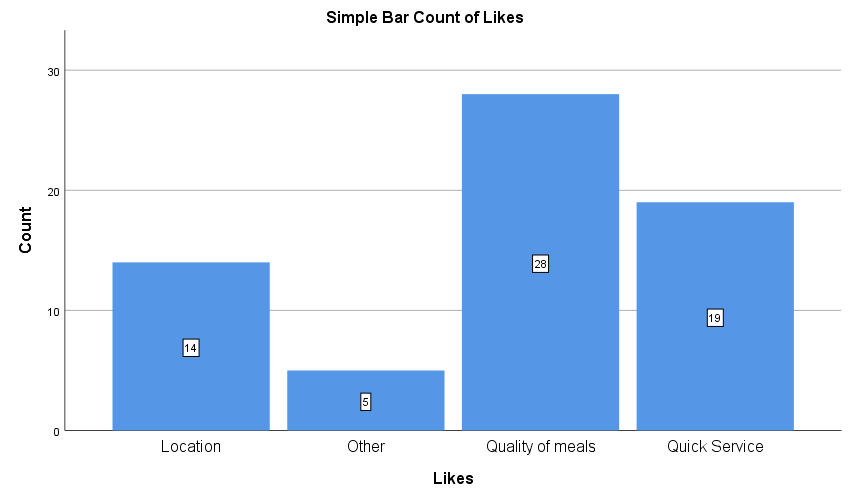
Third, the frequency of answers to the question “What do you like about McDonald’s?” was analyzed. The results are shown in Figure 3 below.
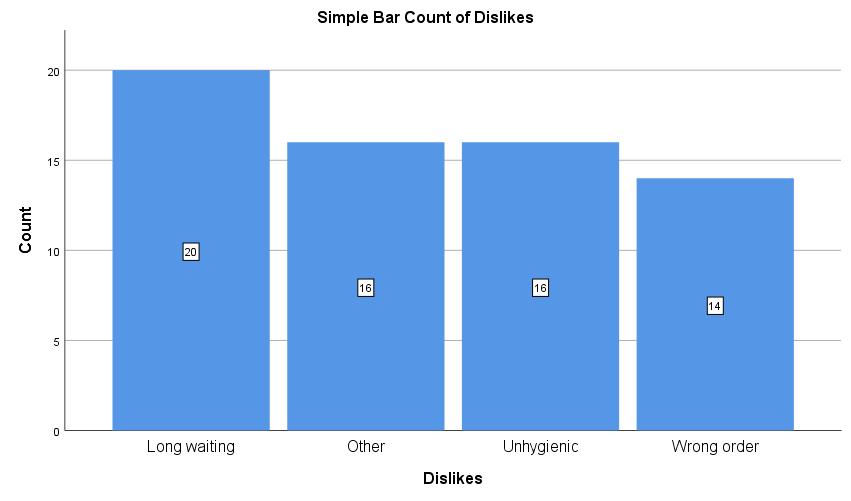
Finally, frequencies for the question “What are the major problems you have faced at McDonald’s?” The results are provided in Figure 4 below.
Mean, standard deviation, minimum, and maximum values were used to describe numeric valuables. Two variables were transformed from string variables to numeric variables to conduct regression analysis. In particular, the availability of healthy food options was recoded to a Likert scale question, where 5 was easy to obtain, and 1 was difficult to get. Additionally, satisfaction level was also transformed into a Likert scale question, where 1 was “very dissatisfied,” and 5 was “very satisfied.” Descriptive statistics for relevant variables are provided in Table 1 below.
Regression Analysis
Regression analysis was conducted to assess the effect of friendly staff and availability of healthy food options on the level of satisfaction after controlling for gender and age group. Gender variable was recoded with 1 standing for Male and 2 for Female. Age Group was also recoded in alphabetical order, where 1 stood for the age group 18-24, 2 stood for the age group 25-29, 3 stood for age group 30-34, 4 stood for age group 34-40, and 5 stood for group 40 and older. The results of the regression analysis are demonstrated in Tables 2 and 3 below.
Results and Recommendations
The results of frequencies revealed some areas of improvement that can increase the level of customer satisfaction. First, more than 62% of the participants stated that if fast food were healthier, they would be ready to spend more money. This implies that the availability of healthy food options is of crucial importance for the customers. Second, 42% of the participants stated that the quality of food was the most liked feature among the four options, which implies that there is no need to improve the quality of food to increase customer satisfaction. Third, the importance of corporate responsibility was unclear, which implies that the effect of improving sustainability practices is not guaranteed to have an effect on customer satisfaction in UAE.
The regression analysis revealed that the availability of healthy food options was had a significant effect on the level of customer satisfaction (p =.004), while friendly staff had no significant effect (p =.135). Moreover, gender and age group also had no effect on customer satisfaction. This implies that the company is recommended to consider introducing new healthy food options in UAE to increase the level of customer satisfaction.
The research results, however, have several limitations that should be acknowledged. First, the sample size was comparatively small, which undermines the reliability of findings (Mellinger and Hanson, 2016). Second, the results of analysis of descriptive statistics were not checked for robustness; thus, they have limited reliability. Finally, the coefficient of determination for the regression analysis was low with adjusted R2 =.127. This implies that only 12.7% of changes in customer satisfaction could be explained by the regression model. Thus, future research should focus on addressing the weaknesses of the present study by adding new variables to the regression analysis and assessing the conclusions drawn from the analysis of descriptive statistics.
Reference List
Mellinger, C. D. and Hanson, T. A. (2016) Quantitative research methods in translation and interpreting studies. Taylor & Francis.