Theoretical Model
This section will present a discussion of: explained purpose of the project; the purpose of theoretical ideas does to the project; the dependent and the independent variables; the proposed econometric model; the signs of coefficients and does semi log models or double log functional forms use non-linear in project (Mankiw & Taylor, p. 26).
Through what we are going to discuss upon there is typically, the theory of the phenomena under investigation brought forward. Let’s start with: The purpose of the project in this case, is the insights into dynamics of growth whereby there is a determining factor of likely investments that can be an important variable for the economy.; the purpose of theoretical ideas does the project is that, is the overwhelming intellectual enterprise and interesting on its own value.; The dependent and independent variables in this case is to show variable on the y-axis whereby an economist would plot price on the y-axis and quantity on the x-axis.; the proposed econometric model shares data outcomes where the shares may take boundary values.; the signs of coefficients and does semi log models or double log functional forms use non linear in the project, in this case the signs and coefficients may differ with similar terms and terms containing the same letters, with semi log models double functional models they use a linear to give a framed review through a graph.
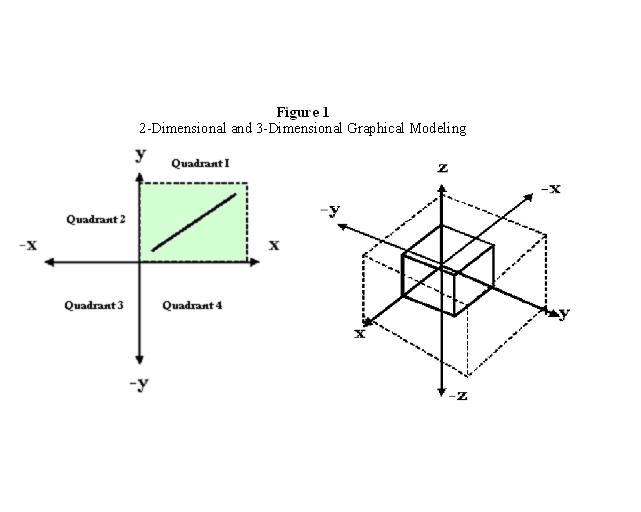
The 3-dimentional space concept of Multi-dimensional graphs can also be represented in 4-dimensional, 5-dimensional, and 8-dimensional until infinity-dimensional spaces. For instant, the 2- dimensional Cartesian opens a new era in economic analysis through single phenomena of which the 2-dimension Cartesian is available to visualize the relationship between the exogenous variable (under the axis =y-axis-coordinates), the endogenous variable (under the horizon axis=X-coordinates).
In the construction of 3-dimentional manifold uses three coordinate system that is “X-coordinate”, “Y-coordinate” and the “Z-coordinate”. The main purpose of the 3-dimensional Cartesian coordinate system in economics is for the study in behavior of two exogenous variables(X, Y) that affects directly on the endogenous variables (z).
Regression results
Regression model is rather a pair of spectacles which allows you to see more clearly the characteristics and data thus the coefficients in modeling economics relationship is restrictive and also more flexible approached to econometric modeling (Mukherjee & White, p. 32).
The variables are generally in two factors the “X” and “Y” axis whereby where there is a high increase in “X” axis there will probably be an increase in “Y” axis. The sign of coefficient generally tells you only the kind of relationship it has (the direction, either positive or negative).
Anova Table
Sourcea | SSb dfc MSd
————-+————————————————
Model | 9543.72074 4 2385.93019
Residual | 9963.77926 195 51.0963039
————-+————————————————–
Total | 19507.5 199 98.0276382
Overall Model Fit
Number of obse = 200
F( 4, 195)f = 46.69
Prob > Fg = 0.0000
R-squaredh = 0.4892
Adj R-squaredi = 0.4788
Root MSEj = 7.1482
Parameter Estimates
—————————————————————————————————
sciencek | Coef.l Std. Err.m tn P>|t|o [95% Conf. Interval]p
————-+————————————————————————————
math |.3893102.0741243 5.25 0.000.243122.5354983
female | -2.009765 1.022717 -1.97 0.051 -4.026772.0072428
socst |.0498443.062232 0.80 0.424 -.0728899.1725784
read |.3352998.0727788 4.61 0.000.1917651.4788345
_cons | 12.32529 3.193557 3.86 0.000 6.026943 18.62364
F-statistics is the value founded from standard statistical test used in ANOVAs and regression analysis to determine if the variances between the means of two populations are significantly different (Mukherjee & White, 51). The significance is the probability of an effect at least as extreme as the current observation occurred by chance.
R-square is at predicting one term to another and the Adjusted R-square modified to adjust of the number of term in a model from R-square.
Violation of classic models
Multicollinearity as explained in googleusercontent.com “it’s a work book demonstrates perfect and near multicollinearity between two independent variables. It uses a subset of the data from Multiireg.xls.
N.Gregory Mankiw, Mark P. Taylor gave an example which explained that “the upward sloping curve shows that members of households with more cigarettes lighters are more likely to develop cancer.” (N.Gregory Mankiw, Mark P. Taylor, 2006).
Irrelevant variables but thing is to boosts the inflation pointers of regression coefficients without yielding any gain in terms of reducing the estimated standard error of the regression.
Heteroskedasticity often ids seen in finance in the prices of stocks and bonds so therefore, it arises in two forms, conditional and non conditional.
Diagnostic test through variance inflation factor explains the relationship between Y and X variables with model.
Extensions to the model, model improvements, and conclusion
Chow test is defined as sets of equality of coefficient in two regressions. Where else models where economic agents designed plans based on their expectations of future demand and supply. Some of these plans were recognized and some were rechecked succeeding times periods thus this affected stocks which also entered the model.
Whoever in model improvement suggestion arises thus prices and quantities in these markets might not be determined exactly together though they may as well be determined within the same time span as one unit of data (Mukherjee & White, p. 74).
Work Cited
- Mankiw, N.G. and Taylor, M.P. Economics. London: Thomson Publisher, Thomson. 2003 Print.
- Mukherjee, C. and White, H. and Wuyts, M. Econometrics and data analysis for developing countries. London: Routledge Publishers, 1998. Print.