Introduction
Many of the biochemical reactions are carried out strictly in the presence of enzymes, special biological catalysts that help to accelerate and initiate chemical reactions. The essence of enzymatic reactions is based on a unique combination of substrate and enzyme, the relationship between which is individual for each pair (Helmenstine, 2020). In this context, it is helpful to clarify that the rate of an enzymatic reaction depends on many factors, one of which is the concentration of the substrate. It is well known that an increased concentration of the substrate to which the enzyme binds through the active center is positively related to the reaction rate: the higher the concentration, the higher the rate. This report discusses the experiment performed with baker’s yeast and verifies the pattern described above.
Methods and Materials
The following materials were used in this laboratory work:
- Baker’s yeast
- Four 500 ml clear plastic bottles
- Four balloons
- Kitchen sugar, sucrose
- Tap water
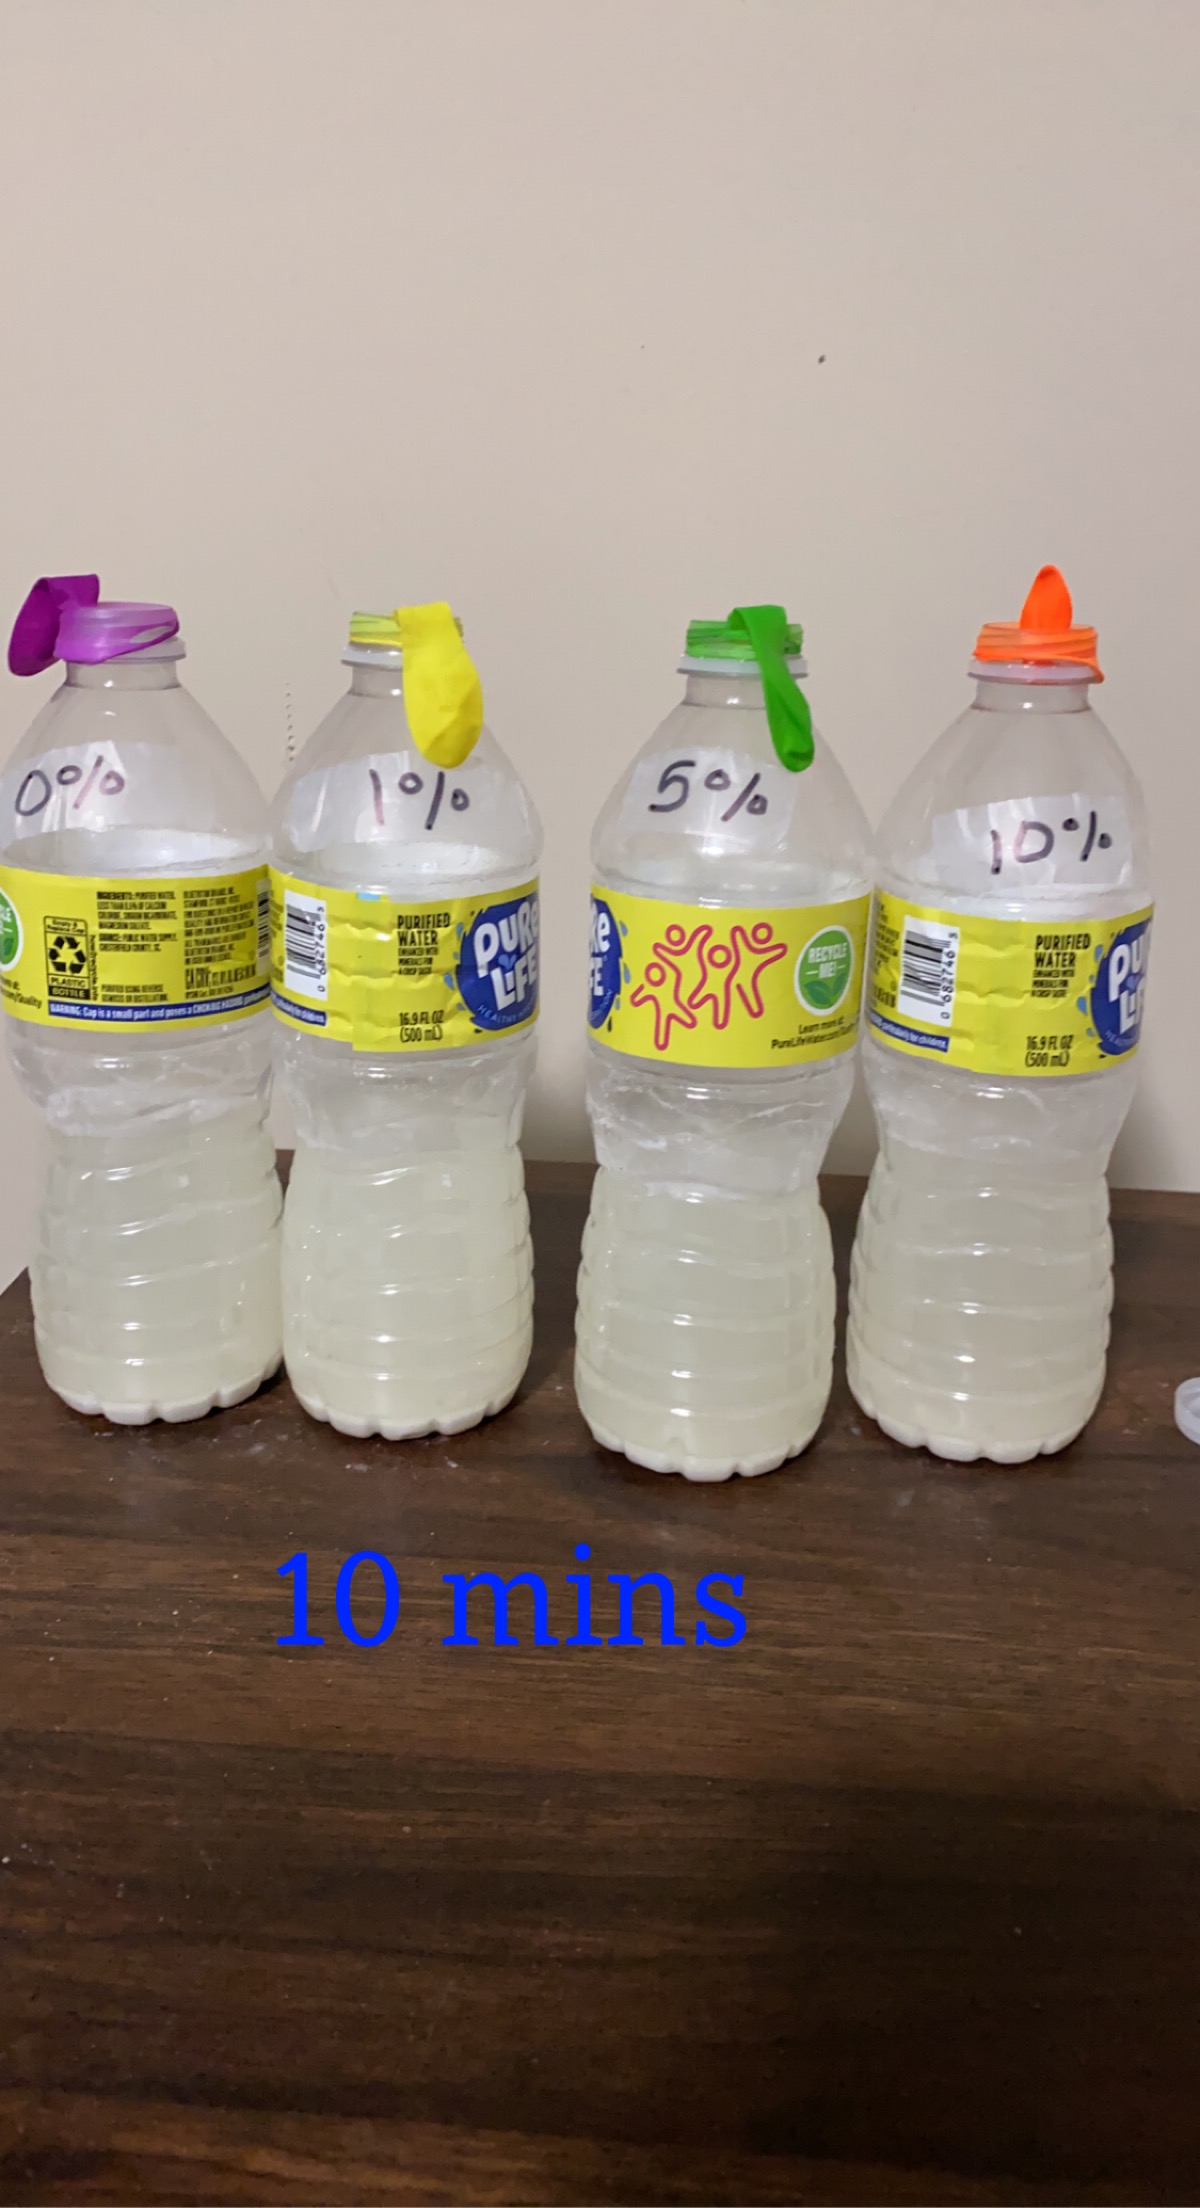
In the present work, a parallel experiment method was used in which four different plastic bottles were observed for comparison. Each of the bottles was carefully labeled for the concentration of added sugar-this included 0%, 1%, 5%, 10% sucrose concentration, or 0, 1, 2.5, and 5 mL of kitchen sugar, respectively. Tap water was added to each of the bottles to the 10 mL mark so as to create appropriate sucrose solutions. In addition, the proper amount of flour was added to each of the bottles (Rodriguez-Velazquez, 2021). An equal amount of dry baker’s yeast was added to the bottles; each container was then shaken until the mixture was completely dissolved. The result of this shaking was a visually observable glucose fermentation reaction, which resulted in the release of carbon dioxide bubbles. In addition, a balloon was placed on the neck of each bottle, which was inflated because of carbon dioxide filling (Denig, 2020). The depth of gas bubble formation and the largest diameter of the balloon were measured with a ruler and then processed statistically.

Results
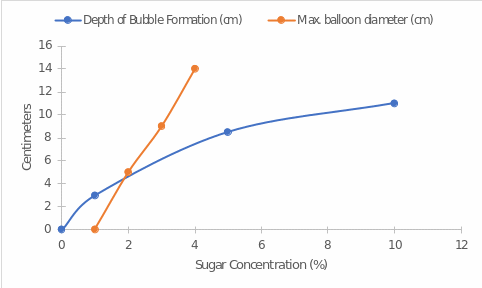
The key results of the present study were obtained both visually and quantitatively. In terms of visual observation, it was seen that the higher the percentage of added sugar, the more saturated the enzymatic reaction was. This was observed both through the number of gas bubbles created and the completeness of the balloon filling. In terms of quantitative results, a data table was created. Table 1 below demonstrates the main patterns of the relationship between bubble formation depth and maximum balloon diameter with the concentration of added substrate. The general pattern is noticeable — increasing sucrose concentration leads to an increase in gas bubble depth and an increase in largest balloon diameter.
Table 1: Summary Table of Primary Results
Discussion
In the present work, the effect of sucrose concentration on the intensity of the enzymatic reaction was evaluated. All other things being equal, an increase in the reaction intensity indicated an overall increase in the rate of the process. The results obtained in the present experiment show that increasing the concentration of sugar as a substrate leads to an increase in the intensity of the reaction. Figure 2 shows that as the concentration of sugar in the solution increases, the depth of gas bubble formation increases more slowly than the bead diameter. It is highly likely that the reason for this difference is the more superficial formation of gases that fill the balloon. On the other hand, the results clearly illustrate that an increase in substrate concentration is generally linearly related to an increase in reaction rate — in other words, the greater the amount of substrate added, the higher the intensity of the enzymatic reaction proceeding.

References
Denig, V. (2020). What is alcoholic fermentation? Liquor. Web.
Helmenstine, A. M. (2020). What is fermentation? Definition and examples.
Rodriguez-Velazquez, S. (2021). The functions of yeast. LibreTexts. Web.