For this week, it was proposed that two quantitative variables measured on an interval-ratio scale be selected in order to determine the extent to which their distribution conforms to normality. Normal should be understood as a distribution that is visually bell-shaped and symmetrical. From the theoretical point of view, such a distribution meets the condition that probabilities decrease continuously and symmetrically as they move away from the central value, which is the peak (Donges, 2021). The first variable of interest was chosen to be the number of people that respondents stated were under their control, YOUSUP. The second variable chosen was the number of hours per day that respondents spent watching TV, TVHOURS. Table 1 below shows the results of the descriptive statistics for each of the variables. From this, one can see that the average number of controls in the sample is 9.47 people (SD = 13.36), and the average number of hours per day spent watching TV is 2.94 hours (SD = 2.84).
Table 1. Results of descriptive statistics for both variables
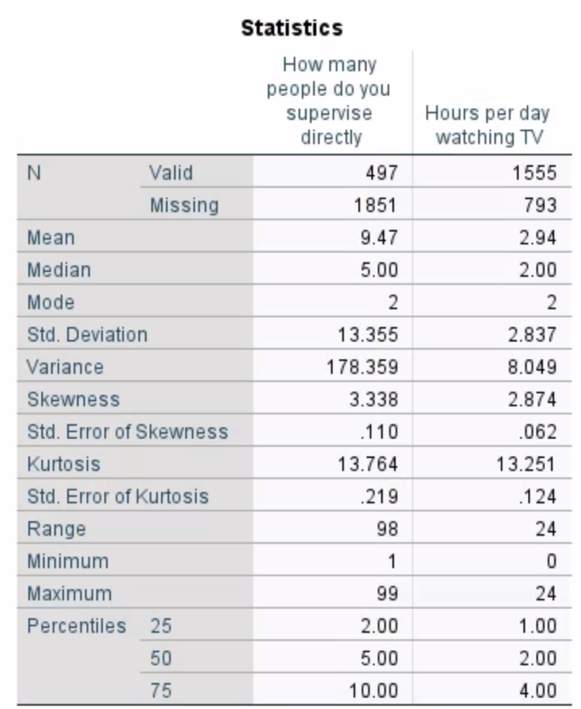
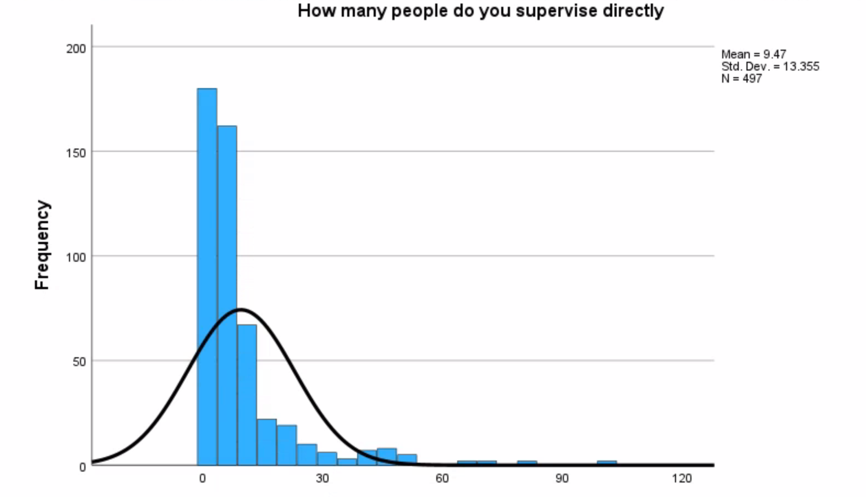
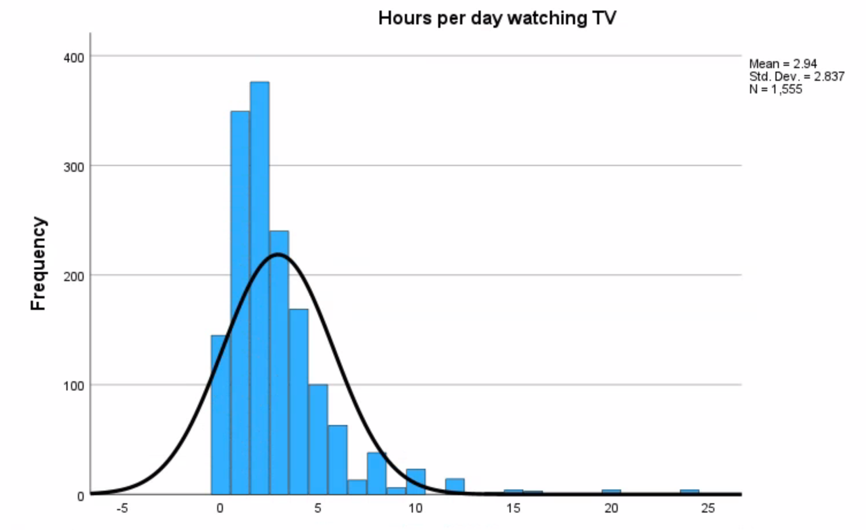
Figure 1 and Figure 2 show histograms of frequency distributions for both variables and also show normal distributions, which allows a primary estimate of the degree of proximity. Thus, both distributions can be classified as unimodal. Regarding the degree of closeness to a normal distribution, it seems that both variables are not symmetric, so they cannot be called normal, even though they are unimodal.
For a more accurate assessment of such normality, one can refer to the symmetry parameters calculated automatically. For the classical normal distribution, Skewness should be equal to zero since there is complete symmetry, and Kurtosis is equal to three (Donges, 2021). As can be seen from the results of descriptive statistics for the two variables, their Skewness exceeds 2.8 and Kurtosis 13.3, which confirms the lack of normality for both distributions.
Reference
Donges, N. (2021). Intro to descriptive statistics for machine learning. Built In. Web.