Introduction
This report proposes a descriptive statistical analysis for the distributions of two variables measured on different scales from the GSS2018 set. The first variable used is the AGE measured on the quantitative (interval-ratio) scale, which characterizes the age of the respondent at the time of sample formation. AFTERLIF was used as the second variable, which was measured on a categorical nominal scale corresponding to respondents’ belief in life after death. This report contains detailed statistical results of the analysis and findings from IBM Statistics.
AGE Variable
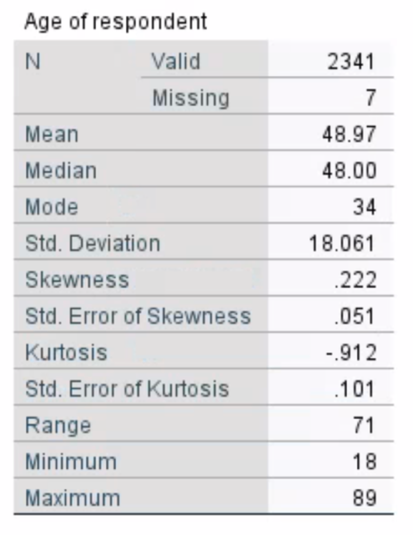
In the GSS2018 dataset, AGE is a quantitative variable classified by IBM SPSS 29 as Scale. This variable determines the distribution of age in a sample of 2348 respondents, seven of whom did not provide a response about their age. A descriptive analysis was conducted to determine the patterns of the central tendency of this age distribution. According to Table 1, the median age of the participant in the sample was 48.97 (SD = 18.06), which means that the average sample representative is an adult. The median value is 48 years old, which divides the entire distribution into two even parts. In the context of fashion, the most common age is 34 years old, and this value occurred 65 times in the sample or 2.8% of all values. The maximum age of the participant was 89, and the minimum was 18, so the range of values is 71. It is interesting to represent this distribution visually as a histogram in order to evaluate additional characteristics.
Table 1. Results of descriptive statistics for the AGE variable
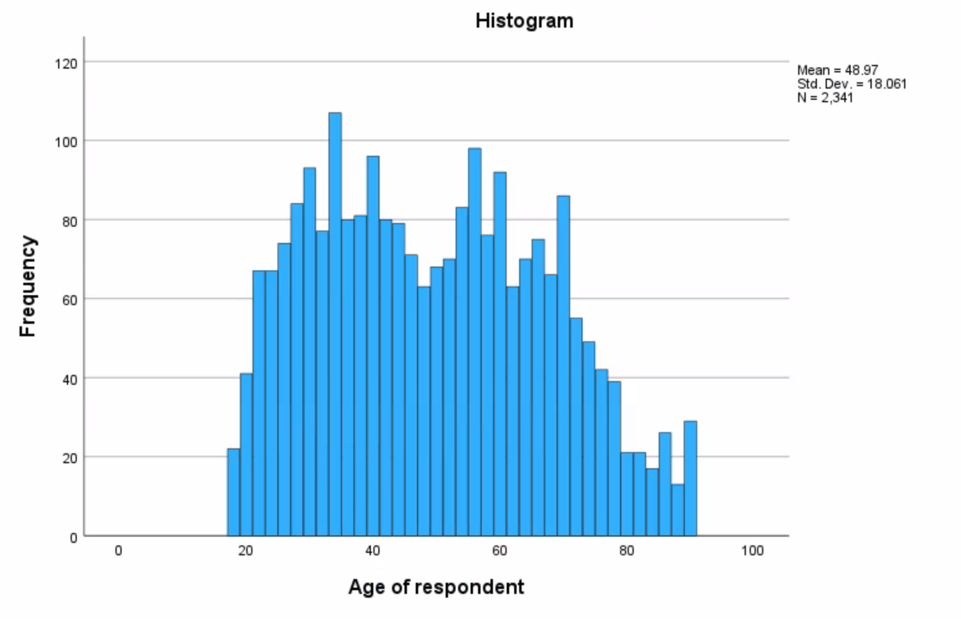
Specifically, Figure 1 shows the histogram of the age distribution. From the point of view of visual analysis, the presented diagram does not have a bell-shaped distribution, which indicates a clear non-normality of the distribution. According to Table 1, the symmetry parameters of the distribution confirm its non-normality, as Kurtosis is significantly different from three, and Skewness is not equal to zero, which means that the histogram can be classified as negatively skewed (Donges, 2021). At the same time, Fig. 1 shows that the shape of the histogram has two peaks, which means that it is bimodal.
AFTERLIF Variable
The second variable chosen for analysis is AFTERLIF, measured on a categorical nominal scale represented by four values. The variable contains respondents’ answers to the question of whether they believe in life after death and measures the degree of agreement on a four-point Likert scale. The total number of responses to this question was 1,129 (or 48.1% of the sample size), as the remainder of the respondents could not answer, or the values were invalid. Table 2 shows the frequency distributions for each of the values of this variable. As can be seen, a total of 38.5% (n = 904) of respondents believed in life after death, of which 28.2% (n = 662) were definitely agreed. A smaller proportion of respondents (9.6%, n = 225) did not believe in life after death. Interestingly, as the definiteness of this belief decreases, so does the number of corresponding answers, which means that most people in the subsample of respondents definitely believed in this phenomenon, and the least definitely did not, which is confirmed visually in Figure 2.
Table 2. Frequency distribution for the AFTERLIF variable
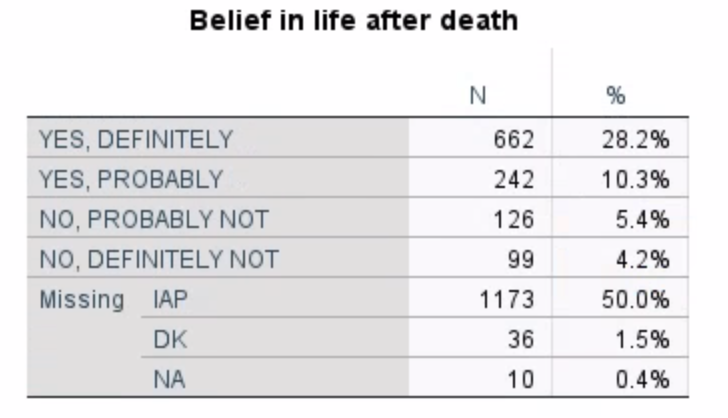
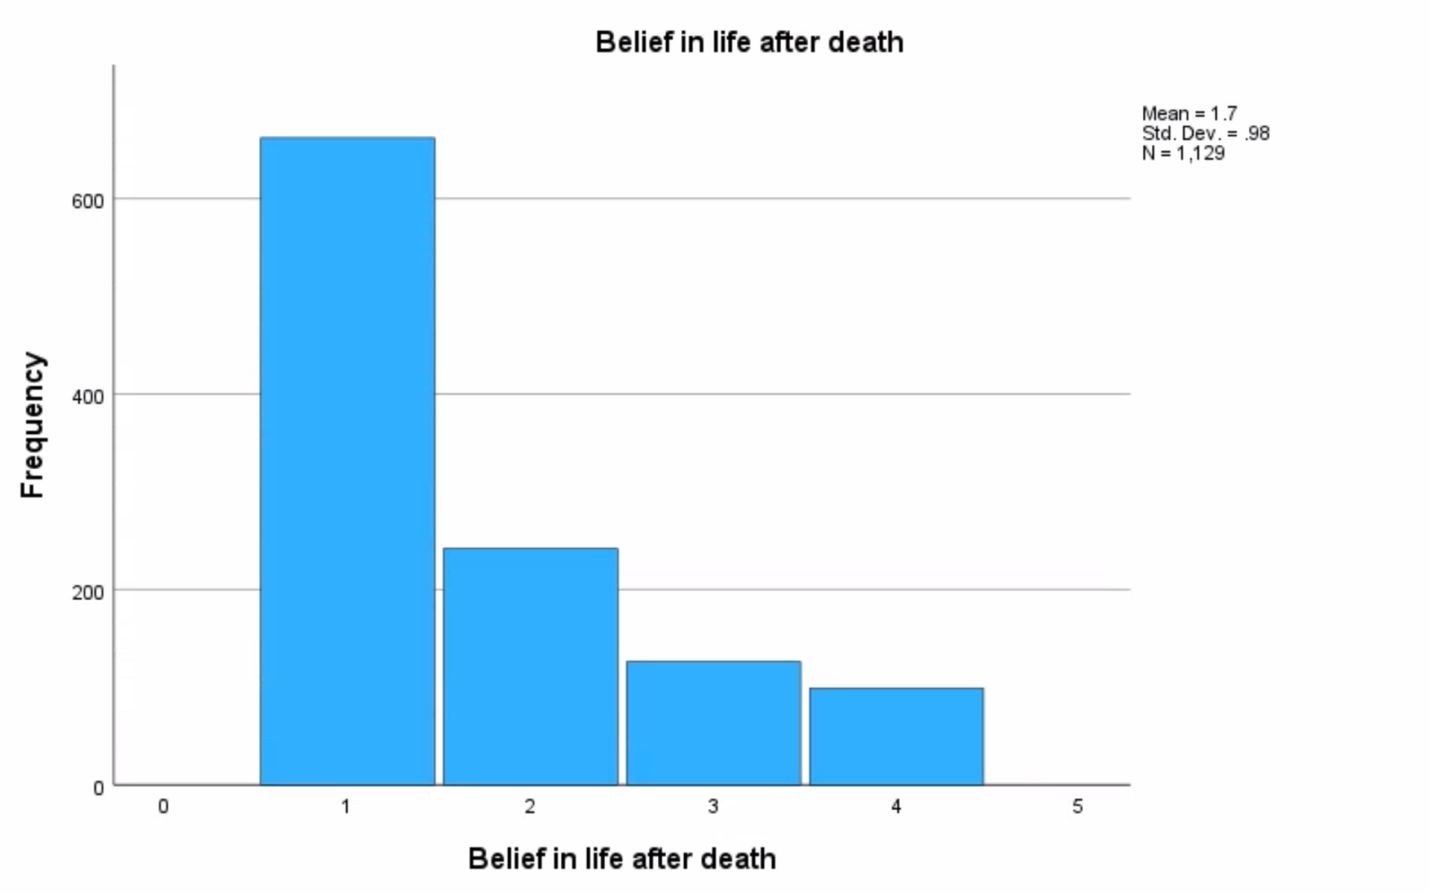
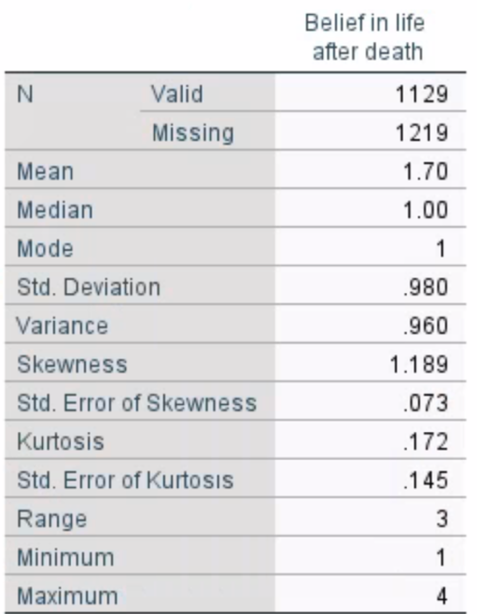
Table 3 shows the results of the descriptive analysis for this variable. The nature of AFTERLIF should be taken into account — it is a distribution measured on a nominal scale, so not all measures of central tendency and variation can be applicable. In particular, only the mode from the central tendency is specific to the nominal variable: the AFTERLIF mode is “1,” that is, a definite agreement with the concept of life after death.
Table 3. Descriptive statistics for the AFTERLIF variable
Conclusion
To summarize, this report conducted descriptive analyses for two variables of different natures: AGE was measured on an interval-ratio scale, and AFTERLIF on a categorical nominal scale; appropriate measures were used for analysis. The results showed that the age distribution was not normal, with the mean age of respondents being 48.97 (SD = 18.06) years. In the context of belief in life after death, less than half of the respondents in the sample answered this question, but of those who did, a large proportion supported the concept.
Reference
Donges, N. (2021). Intro to descriptive statistics for machine learning. Built In. Web.