Executive compensation has been an issue of great academic as well as management interest for the last three decades. The base salaries of executives have risen by 4.7 percent from 2007 to 2008 apart from an increase of stock options from 47 percent to 58 percent in 2008 and a bonus target of 47 percent (Scott, 2008). Even if we do not consider the increase in the percentage of stock options (Hall & Murphy., 2003) provided to chief executive officers (CEO), there has been an increase of average base salary and bonus from $700,000 in 1970 (in 2002-constant dollars) to over $2.2 million in 2000 and an increase in cash compensation from 25 to 90 percent in the same period (Murphy & Zábojník, 2004). The reasons behind such an exuberant rise in executive pay packages are attributed to the increasing complexities pertaining to technological advancement and globalization. But one serious concern that develops is due to the increase in CEO compensation has been an area of interest as well as a concern as it depicts a widening gap of income inequality (MacDonald, 2007). That is why it is important to understand the trend of compensation provided to the top executives in organizations.
The study is based on official statistics of executive pay, as well as available studies which have been published in peer-reviewed journals. First, we will undertake a literature review of the previous researches and then discuss the trend that can be drawn in executive compensation from the studies.
Executive compensation package
To understand the emerging trend in executive compensation it is important to know the components of the executive pay package. On a broad basis, the distinction can be made in two: cash and non-cash components. For greater clarity, we distinguish further into fixed compensation, non-share-based variable compensation, share-based variable compensation, and deferred compensation.
The fixed component of the compensation package comprises the salary of the executive which forms the basis of the compensation package. Apart from these, many companies provide other fixed benefits such as the use of company cars, accommodation, etc. variable compensation may be provided on an annual or long-term basis. One example of an annual-based variable compensation is paid for performance which comes as incentive pay and long-term pay includes stock options. A more recent development is the introduction of stock appreciation rights (SAR) which bestows the right to the executives to receive payment in cash which are calculated based on the appreciation in stock price. Thus, it is comparable to the effects of stock options.
Apart from these companies, provide pension programs, either specifically designed for executives or open to a wider scope of employees. In addition, there are no fixed retirement ages for executives which the company may defer on its convenience. Further many companies either provide termination benefits to their departing executives as a lump sum (known as a golden parachute) or continued benefits. For instance, Michael Eisner of Walt Disney “got a post-termination bonus of $7.5 million a year for two more years, or one year if he takes a role at another major entertainment company other than as an independent producer… [plus] Eisner got an annual annuity of $297,779 for life. Before he stepped down in October 2005, he got $9.1 million in 2005 salary and bonuses” and Edward Whitacre Jr. chief executive of AT&T retired with a golden parachute (MacDonald, 2007).
Literature review
The most interesting explanation of the rise in CEO pay package has been provided through the “fat cat” theory of the popular media (Economist, 2003), which has been expounded by researchers (Bebchuk, Fried, & Walker, 2002) This theory based on the rent extracting behavior of CEOs are referred to as “managerial power theory”. According to the “fat cat” theory, established CEOs use their power over captive boards of directors to bargain and get large increases in pay at the expense of companies’ shareholders1. Thus, this theory emphasizes that that executive compensation is a product of a variety of factors, in particular those related to the discretion and power of executive officers themselves. Apart from information asymmetry, the executive’s discretion results from the dispersion of shareholders which weakens the shareholders’ bargaining power. This further helps the CEO to influence the board of directors which, hereby, increases his/her bargaining power. Such an arbitrary use of positional power will definitely escalate public outrage which is handled by the CEO’s influence in order to “obscure” and “legitimize” their rent extraction (Bebchuk & Fried, 2003, p. 75). This theory shows that executive compensation does not give rise to the “agency problem” rather it is the problem itself.
The theory presented by Bebchuk, Fried, and Walker (2002) and Bebchuk and Fried (2003) is based on the numerous assumptions and the hypothesis that their study takes does not does not provide a satisfactory reason for the increase in CEO pay. Surely, CEOs were trying to extract rents even thirty years ago. But one argument that arises in this respect is that the board of directors, over time, will have increased power and no more be captivated by the CEO. This theory seems to have lost its charm with more recent researches on executive compensation shows that with the boards of directors are becoming increasingly independent, which would make it harder for CEOs to undeservedly increase their pay at the shareholders’ expense (Murphy & Zábojník, 2004). Another problem that has been identified in case of the “fat cat” theory is its implication that CEOs who are promoted internally should receive a higher pay rise than the ones hired from outside. The problem arises because the implication is based on the assumption that because, arguably, they have closer ties with their companies’ boards of directors, but this prediction is not what data regarding CEO pay show. This too has been proven wrong as CEOs hired from the outside earn approximately 15.3 percent more than CEOs who were promoted internally (Murphy & Zábojník, 2004).
The study by Murphy and Zábojník (2004) shows that there has been an increase in the salary of the CEOs hired from outside than CEOs promoted internally. They argue that the reason behind this is based on an increase in the importance of the general relative to the firm-specific component of managerial capital leads to fewer promotions, more external hires, and an increase in equilibrium average wages for CEOs. Their analysis is based on the idea that the “transferable ability is “priced” in the managerial labor market, while firm-specific capital is “unpriced.” Therefore, a shift in the relative importance of general managerial ability will lead to higher wages, and the associated wage increase will be especially pronounced for the highest-ability managers, as competition for the most-talented managers becomes more intense.” (p. 195) Thus, their study emphasizes the importance of the market for CEOs in determining their pay package.
A recent study that tries to understand the reason for the hike in CEO pay package shows that CEO compensation depends on the size of the firm (Gabaix & Landier, 2008). They developed a simple equilibrium model of CEO salary. The assumption this study takes is that CEOs have different talents which they matched to organizations in a competitive assignment model. Their study showed that if CEOs are ranked based on their talents, and if we replace the number one CEO with number 250th then there will arise an increased value o the firm by 0.016 percent. These very small differences in the talent of CEOs are magnified when we consider the firm size and thus I have was shown through huge differences in their salaries. They showed that due to this minuscule talent difference, there is a 500 percent increase in salary (Gabaix & Landier).
The basic assumption that the study took is that talent is the basic element in CEO selection and promotion (Gabaix & Landier, 2008). Based on this assumption Gabaix and Landier made their general equilibrium model. Their model shows that the best or the most talented CEOs manage the largest of the firms. They assume that the CEO’s talent marginally impacts the growth of the firm. The central finding of their model is that CEO’s equilibrium pay is with increases in the size of the CEO’s firm and the size of the average firm in the economy, there is an increase in his pay. The model also demonstrates that there are cross-country differences in the compensation of CEOs. It shows that countries, where the rise in firm value is lower than that of the US, will face a lower increase in executive pay which they tested with the comparison of the US and European pay packages of CEOs. Their study also provided tentative evidence which showed that there is a good fraction of the difference in cross-country compensation level of CEO can be attributed to variations in firm size.
Thus, the study shows that there are very few differences in CEO talent but they help in justifying the large pay differences in the pay of CEOs in different firms. Further, the differences according to the study show that the differences si mainly due to the differences in the size of the firm, further, this is expanded over time and shown that the increase in pay package of CEOs is due to the increase in the value of the firm and increase in market capitalization of the firm. Thus the study shows that a six-fold increase in market capitalization of US firms is the reason for which the pay of CEOs has increased six-fold (Gabaix & Landier, 2008).
In another study on executive compensation trends studied by Ebert, Torres, & Papadakis (2008) was done to understand the cross-national tendencies regarding the institutional framework, structure, and recent major trends in the field of executive compensation. They tried to identify if the pay increase in CEOs and that of the lower-level executives have occurred at the same rate. Their research showed that it has not. Their study distinguished between CEOS, senior-level executives, and their employees. They found that the average pay of American executives increased by 15 percent. 45 percent was the increase in the pay of the CEOs and 14 percent was the increase in pay of lower-level executives, as compared to American workers which were just 2.3 percent from 2003 to 2007 (Ebert, Torres, & Papadakis, 2008). Further, they showed that the ratio of CEO compensation as a ratio of average wages has increased from 369.1 in 2003 to 521.3 in 2008. Further, a comparison with the increase in CEO pay with other executives in terms of components of pay package shows that CEO pay components have all shown a substantial increase in pay as compared to other executive pay from 2003 to 2007. Thus the study reveals one important aspect of executive pay i.e. salary for CEOs has increased more than that of other executives. The reason for this difference has been attributed to the managerial power of a CEO which is assumed to be more than other executives. This provides them the power to exert pressure on the board of directors to increase salary substantially, and the other executives fail to do that. This is in conformation with the “fat cat” theory presented earlier in the study (Bebchuk, Fried, & Walker, 2002; Bebchuk & Fried, 2003). This study further demonstrates that there are differences in the level of salary and its increase in executive salary depending on the country. This confirms that there are cross-country differences in compensation increase in executive pay which confirms with other researches (Gabaix & Landier, 2008).
Findings
We studied the secondary data derived from salary.com of CEOs in 2008. First, we studied historical data on chief executive compensation per hour which provides the following chart. 2 The figure shows that the average compensation per hour for CEOs in the United States has been stable with intermittent increases. This throws a new light in the compensation increase hype of CEOs.
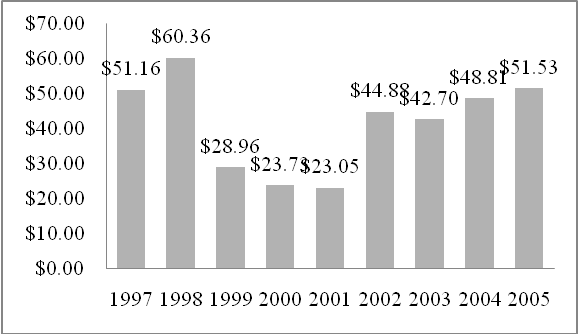
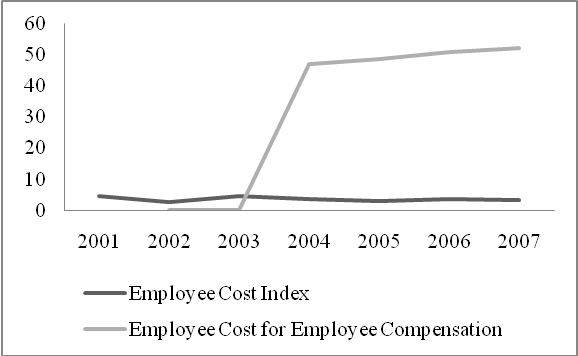
Figure 1 shows that CEO compensation per hour was as high as that it is today (all data at current prices). But there was a huge slump in CEO compensation in 1999, and was lowest in 2001. So if we see an increase in compensation from 2001 to 2005, there has been a 124 percent increase in compensation, which is very high. So if we consider compensation increase from 2001, there has been a substantial increase in CEO compensation. Again, figure 2 shows that there has been a decline in employee cost index for all executive jobs, which shows that there has been an increase in CEO compensation. This further shows that the cost of compensation in total employee cost to the employer has been increasing for executives. This illustrates that even though the cost of employees is declining the cost of compensation is increasing making it take a larger share of the employee cost.
We tried to understand the relationship between experience, education firm size, and industry in determining the differences in the salary of CEOs. We saw that there is an increase in median salary with the size of the firm. The size of the organization was determined by the number of full-time employees in the organization. This confirms the findings of the previous studies that showed that there was an increase in the size of the organization, more salary was provided to the CEOs.
Table 1. CEO compensation for 2008, source: Salary.Com
Conclusion
This shows that there has been an increase in the salary of the CEOs over the years. Our data findings show there has been an increase in the salary of CEOs and the reason that we found is that there has been a decline in employee cost for executive positions in the private sector in the US. this explains the arise in compensation of CEOs. Moreover, we see that as the size of the firm increases in employee strength, there is an increase in the average median salary that CEOs received in 2008. This finding is supported by previous studies (Ebert, Torres, & Papadakis, 2008). From this finding, we may deduce that as CEOs managing bigger companies have a higher degree of power they can use more of their positional power to influence the board of directors to increase their salary. This is in tandem with the “fat cat” theory previously discussed in the literature review (Bebchuk, Fried, & Walker, 2002; Bebchuk & Fried, 2003).
Works Cited
Bebchuk, L. A., & Fried, J. A. (2003). Executive Compensation as an Agency Problem. Journal of Economic Perspectives vol. 17 no. 3, 71-92.
Bebchuk, L., Fried, J., & Walker, D. (2002). Managerial Power and Rent Extraction in the Design of Executive Compensation. University of Chicago Law Review 69 , 751-761.
Ebert, F. C., Torres, R., & Papadakis, K. (2008). Executive compensation: Trends and policy issues. Geneva: International Institute for Labour Studies.
Economist. (2003). Executive pay.
Gabaix, X., & Landier, A. (2008). Why Has CEO Pay Increased So Much? The Quaterly Journal of Economics Vol. 123, No. 1 , 49-100.
Hall, B. J., & Murphy., K. J. (2003). The Trouble with Stock Options. Journal of Economic Perspectives 17(3) , 47-70.
MacDonald, E. (2007). Much Too Golden Years. Web.
Murphy, K. J., & Zábojník, J. (2004). CEO pay and appointments: A market-based explanation for recent trends. American Economic Review Papers & Proceedings vol.94 no. 2 , 192-196.
Salary.com. (2008). Chief Executive Officer. Web.
Scott, J. R. (2008). 2008 Compensation and Entrepreneurship Report Highlights Executive Compensation Trends at Emerging Technology Firms.
US Department of Labor. (2008). National Compensation Survey, USA .
Footnotes
- According to the article about “fat cat” theory in the Economist: “Few bosses these days need to resort to skulduggery to receive fat cheques. For the most part, their employers are persuaded to sign legally binding contracts which hand them large sums of money with few questions asked. They are a bit like medieval knights granted great tracts of land by grateful monarchs.”
- Data retrieved from National Compensation Survey, USA, Bureau of Labor Statistics.