Introduction
The purpose of this report was to forecast USD/CNH Spot Exchange Rate on July 29 2014. Data for the forecasting were obtained from Bloomberg.com.
CNH is the offshore version of the renminbi (RMB).
Abilities to comprehend and forecast the exchange rate and fluctuations at any given moments are clearly imperative in critical decision-making processes, particularly in financial transactions. For instance, at microeconomic levels, small business and people undertake transactions that involve trades in foreign currencies. On the other hand, at the macro levels, large financial institutions and multinational firms influence monetary policies at various levels. Effective forecasting models can enhance confidence of traders in the money market and other areas of the economy (Jakaša, Andročec and Sprčić 1-4; (Peña, Tiao, and Tsay 8).
Forecasting, therefore, has become a critical factor in modern business transactions.
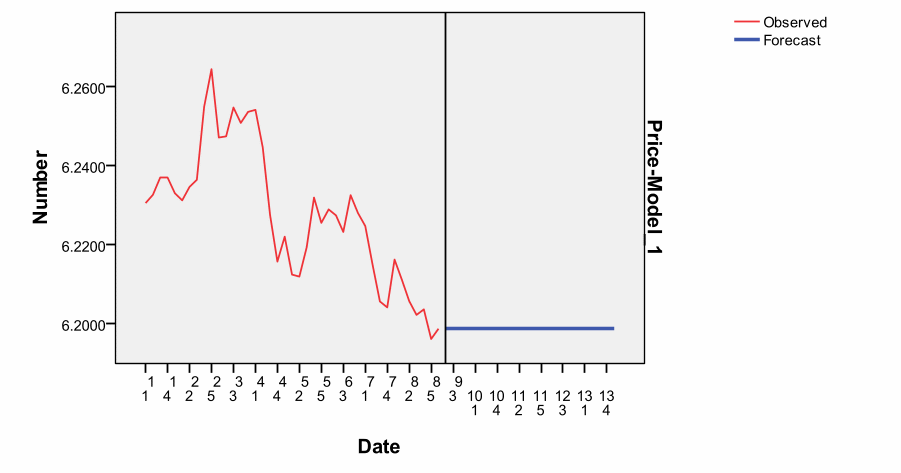
The forecasted last price for the dollar on 29 July 2014 would be 6.1973.
The major drivers included GDP, inflation, interest rates and balance of payment.
Different drivers affecting the CNH spot exchange rate against US dollar
Studies have identified many drivers of exchange rates (Hauner, Lee, and Takizawa 6-8). These factors mainly relate to supply and demand. For instance, an increased demand for products from the US to China would result in appreciation of the dollar. On the other hand, if traders fear economic downturn that could affect the US economy, they then would sell their dollars. This situation would result in a weaker dollar.
A suitable exchange rate is one imperative economic growth indicator. The volatile nature of some exchange rates has drawn many academics and professionals to determine drivers that affect them. Many investors seek to understand market volatility to avoid risks. Forecasting, therefore, has become a tool many investors, financial managers and professionals use to avoid risks and in decision-making. This implies that weak forecasting models could result into harmful decisions and affect returns on investments.
Differentials in inflation are major drivers of exchange rates. Generally, countries that have shown low inflation rates have stronger currencies. In addition, they also have stronger purchasing power as compared to others. For example, from the data gathered, China’s inflation rate is slightly higher than the US (2.3361 and 2.1271 respectively – the most recent data in June 2014). Countries that have high rates of inflation normally experience a “rapid depreciation of their currencies relative to trading partners’ currencies” (Bergen 1). Moreover, it also leads to relatively higher rates of interests.
Variations in interest rates affect exchange rates. Interest rates and inflation are major factor that influence exchange rates. The Federal Reserve can exert control over interest rates and control inflation and exchange rates. If the US offers higher interest rates to lenders than China, then it will attract many investors. In other words, higher interests result in high exchange rates and attract foreign investors, which lead to high foreign capital inflow. This situation is known as ‘hot money flow’ due to high demand for currencies. In addition, it is likely to control effects associated with high interest rates. On the other hand, if high rates of inflation and other factors that slow economic growth exist, then interest rates will be low and result in depreciated exchange rates.
In some cases, speculation in the market affects the exchange rate. For instance, if traders believe that the dollar will rise against CNH, they will demand more dollars and focus on the potential profit later. The demand will result in high value of the dollar. This implies that not all exchange rates and currency movements reflect real economic fundamentals. Instead, market sentiments play significant roles in financial markets. Therefore, if traders believe that the value of the dollar will rise, then the rate of exchange will also rise in anticipation of future profits.
Change in competitiveness of products and services of trading partners affect exchange rates. For instance, if the US goods become highly competitive, then the dollar value will rise alongside the exchange rate. This is imperative for determining the long-term value of the dollar.
Since the global recession and the fear of economic downturn in the US, the value of the dollar has depreciated against other major currencies irrespective of interest rate and slow economic growth in such countries.
The balance of payment of a country affects exchange rates. The current account reflects the trade balance of a “country and its trading partners and all other related payments of goods, services, dividends and interests between countries” (Bergen 1). A current account deficit indicates that a “country spends more on foreign trade that its earnings and borrows more money from foreign countries to cover up for the deficit” (Bergen 1). For instance, data from Bloomberg Financial shows that the US has -44.392 against China’s 31.56 in 2014. The US, therefore, will need more foreign currencies that it gets from the trade to cover up for the deficit. As it demands for more foreign currencies than it receives, it will lower the US exchange rate against its trading partners. Expensive domestic products and services play critical roles in this case while expensive foreign assets could be highly priced for any substantial sales for interests (Pettinger 1). Therefore, if the US continues to struggle to attract adequate capital inflows to counter the deficit, then the value of the dollar will depreciate.
The US public debt could have impacts on the exchange rate of the dollar. For example, in the recent past many investors feared that the US government would default on its debt or fail to raise the limit. Consequently, the value of the dollar declined as some of the investors moved quickly to sell their bonds held in dollars. This situation was observed in Iceland in 2008 when it had debt issues and the value of the Icelandic currency fell.
In some instances, government interventions in their economies affect exchange rates. Many financial analysts have alleged that Chinese government influences the value of Yuan, particularly against the dollar. The currency has remained pegged and undervalued to increase exports and make them cheap. The country actively purchases “the US dollar assets to increase its value against the Yuan” (Pettinger 1).
Finally, political instability and economic growth have profound influences on the exchange rates. Foreign investors prefer countries with stable political environments for capital investments. In addition, they also prefer countries with favorable monetary policies. Investors, therefore, seek for such countries instead of countries with political risks and poor economic growths. Investors can lose confidence in countries with unstable political climate. This could lead to weaker exchange rates for such countries.
In addition, during recession, the value of the US dollar depreciated against major currencies and its trading partners due to a decline in the rates of interests.
Overall, it is difficult to identify a single factor that influences the exchange rate of a given currency due to several contributing factors. However, some drivers of exchange rates have profound effect relative to others. Hauner et al. concluded that “inflation and growth rates appear to be two robust factors that are considered in the formation of exchange rate expectations by market forecasters” (10). Other studies have also highlighted the relevance of forecasting in money markets (Shu 2).
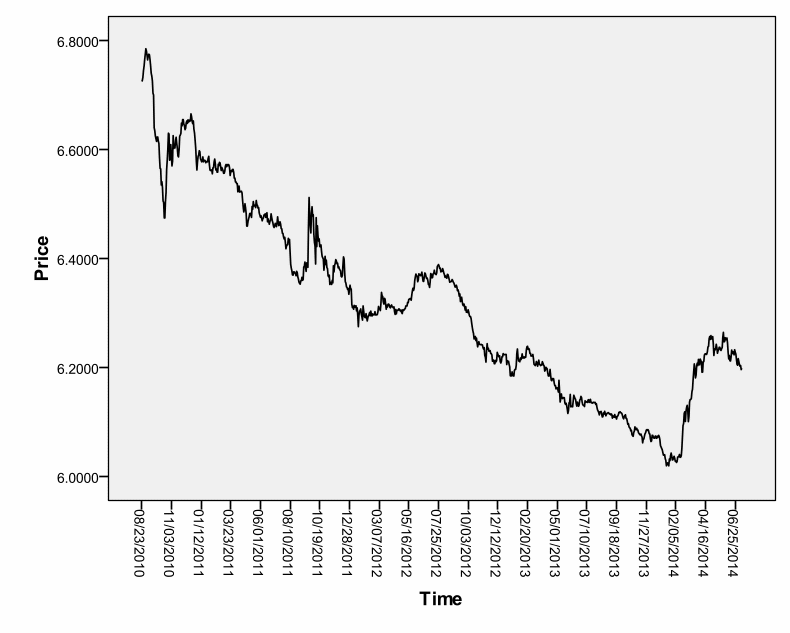
The CNH spot exchange rate against US dollar
Time Series Modeler
SPSS Expert Modeler was used in data analysis to forecast the spot on exchange rate.
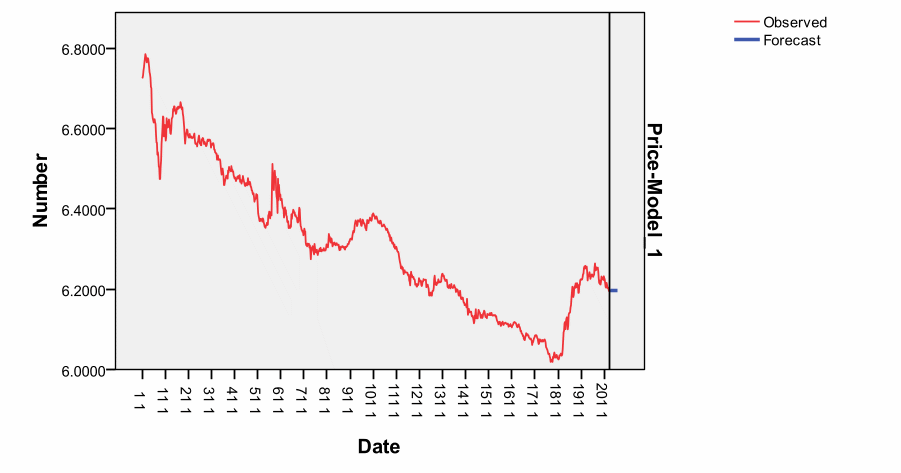
Forecasted Last price of USD/CNH without any other variables or drivers of exchange rates
Forecast with variables.
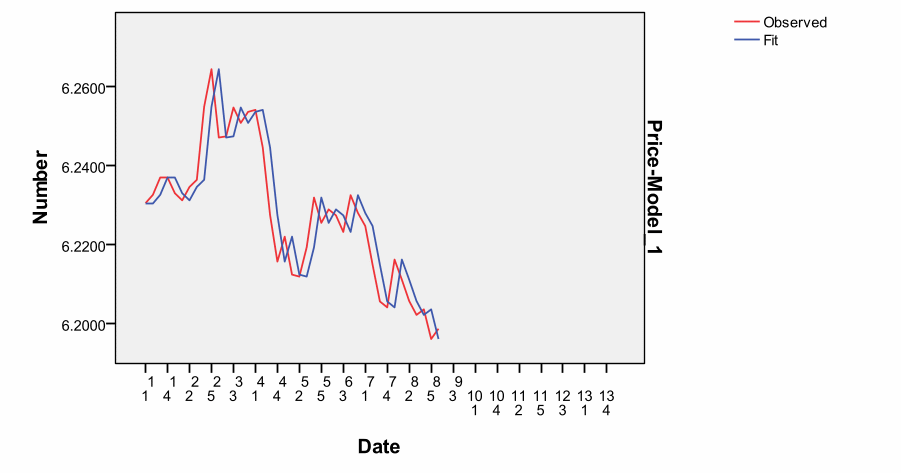
Predictors Fitness
The predicted values indicated agreement with the observed values (IBM Corporation 43). This showed that the model was suitable for predictive purposes. One can notice the relationship between the model and the seasonal peaks as the exchange rates fluctuate on a daily last price basis. Therefore, it captured the variations as they happened.
Conclusion
The exchange rate of the US dollar against CNH depends on several drivers, including both micro and macro economic factors. Forecasting models have become imperative tools in business today.
Since 2010 to present, the value of the US dollar has declined against the CNH. Currently, the figure shows that the US dollar could recover slightly and become stable as its economy experiences recovery. Generally, when the exchange rate of a currency depreciates, it shows a declining purchasing power and incomes derived from capital inflows or any investments.
In addition, the exchange rate has significant impacts on other elements such as inflation, rates of interests and capital inflows and incomes. It is difficult to evaluate the USD/CNH spot exchange rates because of the Chinese government tendencies to manipulate their currencies and make trading patterns’ currencies appear as weak. Investors should consider GDP, inflation, balance of payment and interest rates when forecasting for spot on exchange rates because these are major drivers.
Works Cited
Bergen, Jason Van. 6 Factors That Influence Exchange Rates. n.d.
Hauner, David, Jaewoo Lee, and Hajime Takizawa. In Which Exchange Rate Models Do Forecasters Trust? 2011.
IBM Corporation. IBM SPSS Forecasting 19. the United States: SPSS Inc., 2010. Print.
Jakaša, Tina, Ivan Andročec and Petar Sprčić. “Electricity price forecasting – ARIMA model approach.” 8th International Conference on the European Energy Market (EEM). Zagreb, Croatia: EEM, 2011. 1-4. Print.
Peña, Daniel, George C. Tiao, and Ruey S. Tsay. A course in time series analysis. NewYork: John Wiley and Sons, 2001. Print.
Pettinger, Tejvan R. Factors which influence the exchange rate. n.d.
Shu, Yan. Modeling and Forecasting Daily Exchange Rates with Long-Memory GARCH Processes. 2006. Web.