Traffic Statistics
Traffic ranking
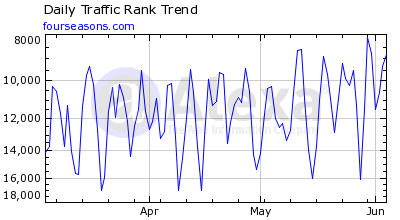
From the statistics above, Four Seasons traffic rank has been experiencing a significant drop in the past 3-month period. From the statistics above, the company’s site had experienced a worrying 1045 decline in the April statistics. This was succeeded further by 875 and 461 drops for the months of May and June, respectively. The reason for these significant drops may be a result of the misalignment between the company’s market search strategy and its customer acquisition goals. The company’s chosen keywords may be unsuitable (compared to its competitors) in its operating market hence its current loss in customer acquisition.
Reach
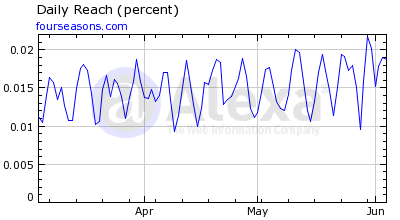
Percentage of global Internet audience which visit Four Seasons:
From the statistics above, the number of global internet users who visit Four Seasons has kept on increasing when comparisons are made to other international sites. This may be attributed to the company’s increased marketing strategy that has seen it place online adverts to attract the audience to its site pages.
Pageviews
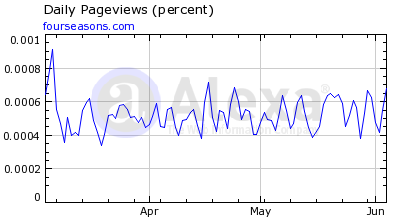
Percentage of global pageviews on Four Seasons:
Likewise, the company’s site has experienced a small increase in the number of pages viewed by its users, especially in the last two months. The growth may be attributed to users’ keen interest in ‘flip’ through the company’s many titles and sub-titles, which increase the number of pages viewed by users.
Moreover, the management has linked the entire sister hotels and resorts to the ‘mother’ site. According to Four Seasons Homepage (2011), the site’s home page displays the image of the hotel headquarters in Toronto- Canada. Users are then prompted to click on ‘Find a hotel or a resort.’ On clicking, various hotel or resort names are displayed from across the globe. A click on any one of them shows the image of the hotel or the resort. The described instances also increase the site’s page views.
Pageviews/users
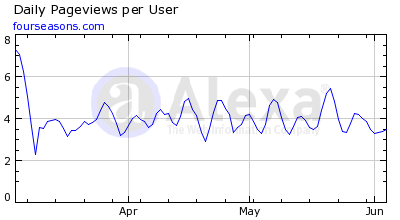
Daily pageviews for each user:
However, the statistics above should be noted when averages are compiled to determine the unique pages visited by each user for 3 months. It is established that the percent change drops with a relatively small margin. This might be attributed to the tendency of the company’s management not to carry out frequent updates on most of its page contents, thus leading to users’ dissatisfaction.
Bounce %
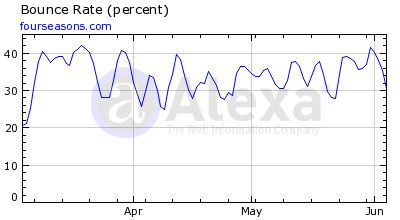
The %-age of visits to Four Seasons that consist of single pageviews:
Referring to the above statistics, the author notes that the %-age visits to the Four Seasons site that consist of single-page views have increased. This might be due to the management structuring the site such that users can derive their specific information of preference on single pages. For instance, visitors who may have ‘bookmarked’ the ‘Four Seasons Atlanta Resort’ link can easily access all the pricing and reservation details on this single page.
Time on site
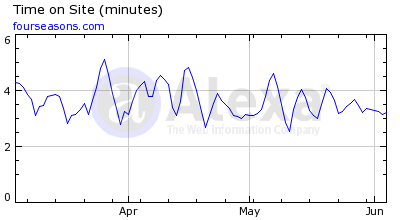
The daily time spent on Four Seasons:
From the above statistics, the duration of time that users spent on fourseasons.com has been reducing in the last 3-month period. This might be for a variety of reasons, which may include the ability of the users to easily find their preferred statistics or the inability of the users not to find out their selected statistics. This might have caused their dissatisfaction leading to less spending time.
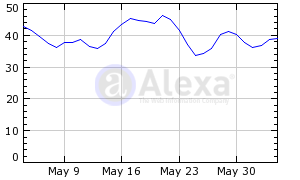
Search %
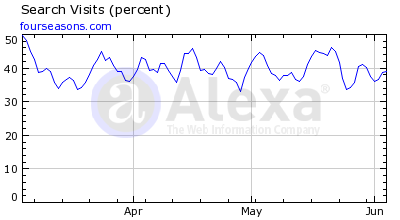
Drawing inferences from the above statistics, the author points out that the %-age of visits to the company’s site originated from search engines has kept on shifting. In May, the percentage change had dropped to -1%, while in the next month of June, the statistics had improved by a margin of 2%. The fluctuating pattern may be attributed to the management’s inability to implement search engine optimization for this company.
Search Analytics
From the statistics above, search traffic has been tremendously increasing for the Four Seasons site. The company’s primary site (fourseasons.com) led to the number of search engines directed at it. This motherland site had a total of 12.55% as compared to the least sister company (Nevis), which had a percentage of 0.86%. The increase in the search engine visits may be attributed to the company’s increased use of keyword-rich tags that encompass, amongst others, four seasons, hotel resort, resort, hotel, resorts, and home (Four Seasons Homepage, 2011).
Audience
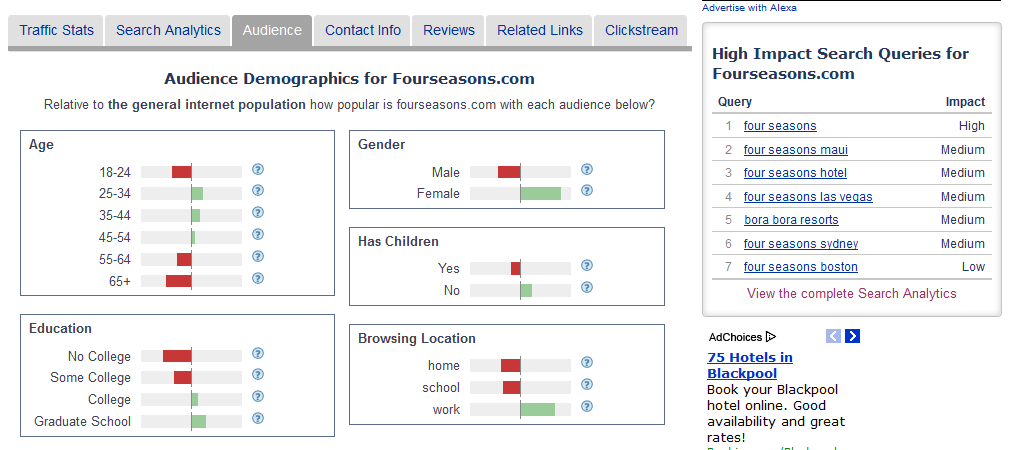
The following findings can be said on the popularity of Four Seasons audience:
On the age category, the above Alexa statistics reveal that the company’s site is more popular with the category of persons whose age bracket falls between 25-34 years. However, the site is not popular with the category of people aged 65 and above. This may be attributed to the increased tendency of holidaying amongst the middle-aged as opposed to the aged persons.
Moreover, the following findings can also be highlighted on the company’s site:
- Statistics reveal that many females pay a visit to the site compared to the decreasing number of males.
- Most graduates pay a visit to the site.
- Children do not pay visits to the site at all.
- Most people access the site while at work.
Reviews
The company has had no reviews written on it.
References
Alexa (2011). Fourseasons.com. Web.
Four Seasons Homepage (2011). Four Seasons hotels and resorts. Web.