Abstract
The research paper aims to assess the relationship between GPA and gender by applying correlation analysis with stratified sampling. In this study, a sample of 105 students (41 males and 64 females) participated. A teacher provided information about the students, such as student ID, first and last names, GPA, and gender. This information was then analyzed using an Independent Samples Chi-square to determine if H0 (null hypothesis – there is no relationship) is supported or if H1 (alternate hypothesis – there is a relationship) is supported (Privitera, 2017). Using this chi-square, it is determined that p = 0.0,48, making p < 0.0,5 indicates a significant statistical difference and a relationship between GPA and gender. Grade point average (GPA) is important to students, both males, and females. However, there is a difference in GPA when comparing males and females. Using a sample of students, an Independent Sample T-test was performed on male and female GPAs to see if there was a significant statistical difference. Suppose this study shows that (p) < 0.05, then there will be statistical significance that there is a difference in GPA between males and females, resulting in the rejection of H0 (there is no relationship between GPA and gender) and supporting H1 (there is a relationship of GPA and gender).
Introduction
Statistical research involves the rigorous development of new and improved statistical methods and approaches grounded in probability and statistical theories. The statistical study aims to select data samples, prepare questionnaires and surveys, and conduct logic checks to maintain the information’s quality. Grade point average involves the calculations of individuals’ average grades and results on different tests according to their performances. GPA is normally calculated every year or for individuals’ courses as a whole. GPA is calculated on the following basis: each result is assigned a number referred to as a grade point. The higher the results, the higher the grade point. To execute the relationship between the GPA and gender, the research was carried out based on a quantitative study using correlation analysis. The quantitative study uses statistical tools and information where data is collected in numerical form and analyzed using correlation techniques. To determine the relationship between gender and GPA, the research would use the correlation analysis techniques such as Chi-square.
Literature Review
According to Górowski (2020), females have better GPAs than males. A student’s GPA indicates how well that individual does in school across different subjects. This scale matters because it gauges how well a student is learning, indicate to teachers if the curriculum needs reconstructing, displays competitive performances with students to receive awards, and paves a road to higher education where students begin to prepare for college, universities, and careers. Alternatively, this research argues on the major factors attributed to the great performance of the female as opposed to the male students. For instance, persistence, attentiveness, and higher lecture attendance among the females were listed as the major factors contributing to higher GPA among the female students at university. The research factors listed above have also affirmed a significant relationship between GPA performance and gender at the universities. Therefore, contributes to these major distinctions between the GPA of male and female students.
Interestingly, McDowell and Klattenberg (2019) point out that there are more female teachers than male teachers, which could indicate why females have better GPAs. Furthermore, depending on a student’s GPA, they can qualify for different scholarships and awards, participate in sports and extracurricular activities, get accepted into colleges and universities, and even apply for specific jobs. McDowell and Klattenberg (2019) have also argued that there is a higher likelihood that more female instructors are likely to favor female students. For instance, being on the motion to increase their opportunities in the job market. It has, however, been debated that the prospects for females in the job market and at various education centers have increased. More significantly, international organizations have advocated for gender equality roles in different segments of the economy. Therefore, all these factors combined have contributed to the outstanding performance of the female students based on the GPA ranks compared to the male students.
Himaz and Aturupane (2021) explain that females attend college and universities more than males. The increased number of females attending universities has contributed to a higher average GPA for females than for women. For example, many university programs have favored women compared to men. In addition, the rates of female students have been increasing in both college and university education. Thus, there is a strong relationship between GPA and the number of university students, particularly female students.
According to Friedman et al. (2020), in 2017, the number of females attending higher education had reached its peak compared to males and is expected to rise until 2030 steadily. Therefore, comparing males’ and females’ GPA differences is essential because it could reshape psychological studies on genders and cognitive awareness of this difference to better assist students and teachers within schools to level GPAs for both genders. In addition, the high number of opportunities awarded to females has increased their university attendance. As such, this increment has further increased their performance compared to the males. Therefore, this information has a significant role in streamlining the education and learning requirements to best suit males and females equally in terms of their GPA index.
One example, Diette, and Raghav (2017), state that males have a more difficult time with morning classes than females, resulting in lower GPAs (Privitera, 2017). It could help a male student’s GPA by having school counselors place their more complex classes in the afternoon. The shift could also have a significant impact on their attendance. For example, if more courses in the technical subjects are shifted to the afternoon, there is a higher likelihood that the male students will increase their attendance. The attendance of classes has a higher impact on the final GPA performance because of the concepts that will be taught in class. As such, by boosting their attendance, there is a higher probability that their GPA will increase. Therefore, by the counselors shifting their classes, there will be more improvement in the male GPA in schools.
In addition, Privitera (2017) argued that gender has mainly influenced academic performance in many ways, especially among students. For example, the fact that women have been given more chances compared to men over the past affirms that they will perform better in terms of GPA. Consequently, the gender rules contributed to more changes positively in the academia of females. As a result, the male students have been ignored in terms of the factors affecting their education performance index at school. Therefore, female students tend to perform better than male students in terms of GPA because of the excellent representation in terms of opportunities over the past.
Methods of Study
Participants
The research included 105 students (n =105), where 41 were males and 64 were females. The data was represented on a table consisting of four rows and four columns. The rows represented the gender, mean, number of participants per gender, and their standard deviation. Both the independent and dependent variables were also drawn an all the genders. The independent variables included the age, IQ of the participants, and the behaviors of the participants. On the other hand, the dependent variables included the degree of attendance at lectures and performance in the previous examinations (Privitera, 2017). Therefore, both variables played a significant role in data collection and further analysis.
Research design
The research used a quantitative study approach where data was collected using statistics and presented in a table for analysis. The research used the students as the participants. First, the study was conducted by applying correlation analysis, considering stratified sampling as a population collection measure. Then the data used correlation analysis and a T-test to analyze the collected and recorded information. The data was then input into a software called SPSS (Statistical Package for Social Sciences) for data analysis.
Measures
The research used statistical Chi-square to test whether there was a relationship between gender and GPA. All the information was collected and tabled concerning the number of male and female participants. In addition, the mean of each gender was collected, and the total mean was included. Furthermore, the standard deviation in each gender was recorded, d including the absolute standard deviation of the data (McDowell & Klattenberg, 2019). According to Privitera (2017), Independent Samples Chi-square are inferential data used to compare means in two different independent groups (in this case, male and female) to determine if there is a significant statistical difference from that population (GPA).
Data Analysis
The research used quantitative research design and correlation analysis to study the relationship between gender and GPA. Data were analyzed using SPSS software to output the required outcomes. The software was used because of its simplicity and ability to hold a more extensive data set. SPSS also has many functions that could help in attaining the required analysis within a short time. A correlation analysis was conducted to assess the existence of this relationship. However, before the data was analyzed, it was sorted to ensure that the missing variables that could have been left during data collection were rectified and the bias corrected. The data was manipulated to help the researcher reduce the bias resulting in the study’s end. As a result, based on the data collected, there was a higher expectation that there could be a positive relationship between GPA and gender.
Assuming a normal distribution with sample size to mean μ and standard deviation σ. Then there is a higher likelihood that it has a chi-square distribution=n.

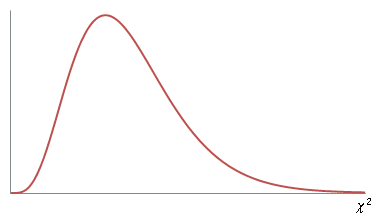
The graph indicates that there is a significant relationship between GPA and gender, and the data suggests that there is a meaningful relationship between gender and GPA. The null hypothesis always rejects the assumption that the GPA and gender are not correlated. On the other hand, the alternative hypothesis indicated that the GPA and gender are correlated (Himaz & Aturupane, 2021). The chi-square methods compare the data using the standard deviation and the overall mean of the variables.
Results
According to the chi-square test, the p = 0.04,8, p < 0.05, indicates a significant statistical difference in the relationship between GPA and gender. The test shows that the data is incompatible with H0 rejecting and accepting Ha. The test indicates that H1 is correct and that a significant statistical correlation exists between GPA and gender. In addition, the data illustrates that the mean and the standard deviation of the collected information are varied, meaning that certain factors interfere with the GPA among the males and the females (Górowski, 2020). This indicates that the existing difference in GPA among males and females is determined by particular independent and dependent characteristics portrayed by both genders.
Discussion
The relationship between gender and GPA is a broad topic that requires deep study and analysis of the data to reach a valid conclusion. GPA is determined by various factors, which are shown by both genders. However, the results have depicted that females have a higher GPA than males. The relationship has thus affirmed the verdict of Górowski (2020) that females have a higher GPA than males. Attendance and persistence could contribute to the GPA and more opportunities advocated for by the gender policies over the past. The degree of understanding of various concepts by both males and females is different due to the difference in interest, level of IQ, and behaviors indicated by the genders in capturing different concepts in different academic fields. Critically, females are perceived to have a high level of concentration resulting in a high IQ level compared to males. The outcome has been argued further by research by Diette and Raghav (2017), where the female attendance in classes has been higher as compared to the male. However, there are various limitations surrounding this phenomenon, such as social-economic status, environmental background, and parenting status, which bring the differences in GPA among the males and females. The research was reliable and valid because it used the correct correlation analysis techniques (Chi-square), which critically analyzes null and alternative hypotheses to bring out the actual relationship between GPA and gender. The provided information was factual and cannot be skewed (Friedman et al., 2020). In addition, the provided information has enabled the researchers to verify the reliability and validity of their study as it has no gaps.
Conclusions
To recap, the data has indicated a significant correlation between GPA and gender. The Chi-test is a successful statistical test that compares the data by calculating the significance level through the hypothesis test. The alternative hypothesis indicates a significant correlation between the variables under consideration. Thus, some factors affect the level of GPA among males and females. It’s found that females have a higher GPA than their male counterparts. This difference is brought by either inherent or environmental factors such as socioeconomic status and parenting among both genders (Diette & Raghav, 2017). The Chi-square test has enabled the research to execute the existing claims about the relationship between gender and GPA. Primarily, the Chi-square is used when testing the hypothesis of certain information using the collected information’s mean and standard deviation.
References
Diette, T. M., & Raghav, M. (2017). Does an early bird catch the worm or have a lower GPA? Evidence from a liberal arts college. Applied Economics, 49(33), 3341-3350. Web.
Friedman, J., York, H., Graetz, N., Woyczynski, L., Whisnant, J., Hay, S. I., & Gakidou, E. (2020). Measuring and forecasting progress towards the education-related SDG targets. Nature (London), 580(7805), 636-639. Web.
Górowski, I. (2020). Importance of gender, location of secondary school, and professional experience for GPA—A survey of students in a free tertiary education setting. Sustainability (Basel, Switzerland), 12(21), 9224. Web.
Himaz, R., & Aturupane, H. (2021). Why are boys falling behind? Explaining gender gaps in school attainment in Sri Lanka. World Development, 142, 105415. Web.
McDowell, J., & Klattenberg, R. (2019). Does gender matter? A cross-national investigation of primary classroom discipline. Gender and Education, 31(8), 947-965. Web.
Privitera, G. J. (2017). Statistics for the behavioral sciences (3rd ed.). SAGE Publications, Inc.