Summary
This report was commissioned by the D.M. Pan Real Estate Company’s sales team. The report aimed to study the correlations between the area of the real estate objects measured in square feet and the selling price to benchmark. The final deliverable of the model was to create a model for the sales team to use for setting the prices for houses based on their area measured in square feet.
Representative Data Sample
In order to achieve the purpose of the report, a random sample of 30 houses from the East South Central region was taken using Microsoft Excel. The listing price and the square foot variables are provided in Table 1 below. The sample is provided in the supplementary Excel document.
Table 1. Descriptive statistics of the sample
Data Analysis
The generated sample does not appear to be reflective of the national market due to the differences in the descriptive statistics. In particular, the mean listing price of the national market was $342,365 with SD = $125.915, while the mean listing price of the sample was $286,690 with SD = $125,402. While the dispersion of the sample and the population were comparable, the mean of the sample was lower than that of the population. The average house size was comparable in the sample (M = 2,441; SD = 1,149) and in the population (M = 2,111; SD = 921); however, the differences were also evident.
The sample was randomized using Microsoft Excel. First, all the listings from the East South Central region were copied to a new tab and a new column that included a random number was created. After that, the listings were sorted according to the random number, and all the listings except for the first 30 were deleted.
Scatterplot
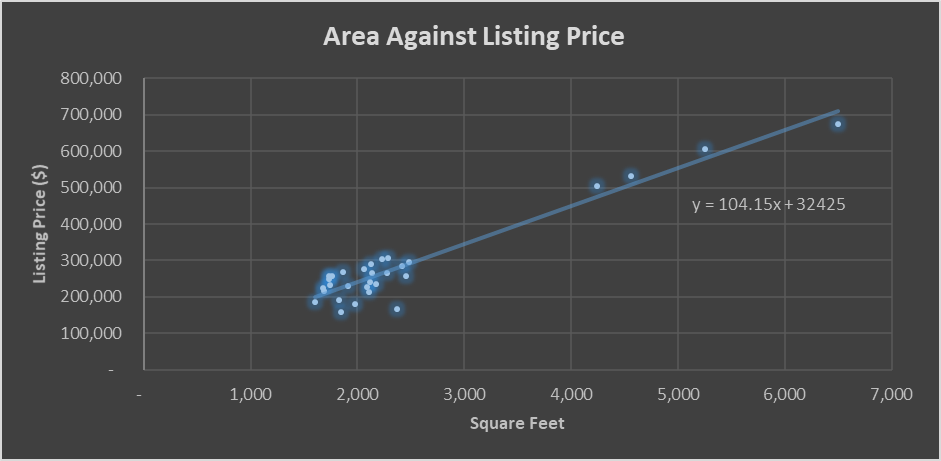
In order to examine the relationship between the listing price and the area of houses, a scatterplot was created. It is provided in Figure 1 below.
The Pattern
The scatterplot above demonstrates a relationship between the area of houses measured and square feet and the listing price in US Dollars. The x variable is the area, as it can be used to predict the price of the listing, while the y variable is the listing price, as it is the variable that needs predicting.
The scatterplot demonstrates a strong association between the area of the house and the listing price. The dots in the plot appear to be scattered along a linear trendline. The majority of the data points are clustered around the are roughly between 1,500 square feet and 3,000 square feet. However, there some outliers, which demonstrate that a few large houses in the area were sold. The relationship between the variables appears to be linear, as the data points create a linear shape rather than exponential or any other shape.
The scatterplot also represents an equation that can be used to predict the listing price. In order to estimate a listing price, one should put the are of the house measured in square feet as an x in the following equation:

Thus, the benchmark listing price for a housed with an area of 1,800 feet, for example, can be calculated the following way:

The example provided above demonstrates that the benchmark listing price for a house with an is of 1,800 feet will be $219,895.