Introduction
Operations management is defined as the all processes that contribute to the transformation of inputs to become finished goods and services. The operations of firms vary from country to country and it is the scope of this paper to investigate how operations of firms between countries contribute to their respective GDPs. The flow of goods and services between the countries is what contributes to their difference in balance of trade. The balance of trade is variation in the value of both exports and imports in accordance to the monetary value. These imports and exports are in the form of goods and services (Heizer 193). There is the difference between operations management in different countries and we will look into each country and compare them. With the rise in globalization we cannot ignore the fact there are emerging markets that have come up such as India, China, Mexico among others. There has been focus on the internalization of operations that center on production, and technology. It is the countries that center their attention towards this factors that are sure to make headway and grow their GDP numbers. The GDP of these countries is also ruled by factors such as manufacturing operations, Global supply chains, Facilities and their locations, productivity of workers, the general design of human resource structures, Information management systems and process development and technology transfer. We will now look into the different countries and compare their GDP’s in respect to the goods and services (Heizer 205).
USA
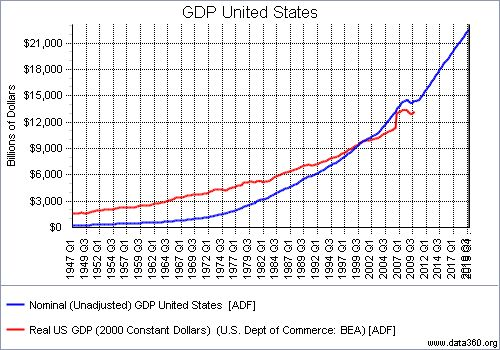
Being the leading national economy in the world, the gross domestic product of the US, easily surpasses most countries by a big margin and a good example of this is last years GDP was reported to be at 14.2 Trillion Dollars, easily surpassing the second biggest national economy Japan by almost twice that figure. From the 1970’s US GDP has managed to remain stable despite external factor such as corporate governance scandals, terrorist attacks and major Wars that it continues to run up to today. The stable GDP is attributed to aspects such as low unemployment rates and increasingly high rates in capitals investment among others. When it comes to the manufacturing sector, the US, is the leading manufacturer as it is has concentrated its manufacturing resources in industries such as petroleum, steel, automotive, aerospace among others (Heizer 56)
China
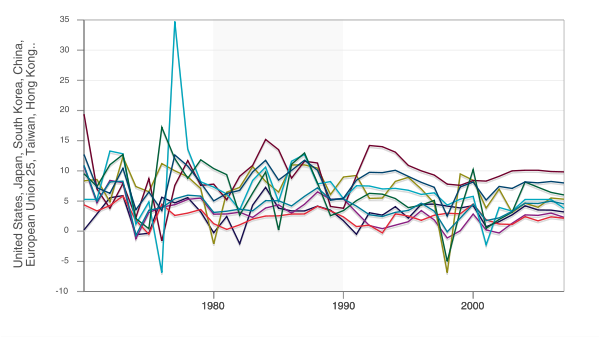
As of 1970, the economy of China was1% of the world’s economy and by 2007 china became the third largest economy contributing to 6% of the World’s economy. In recent times China has overtaken Japan to become the second biggest economy rivaling the US, as the biggest exporter of manufactured goods (Heizer 23).
UK
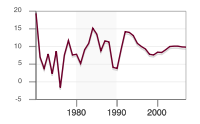
In this chart we see that the level of output since 1948 steadily rose up to the point that in 2006, UK’s GDP at constant 2003 was estimated to be at £1,209,387 million (£1.21 trillion). This was an upward shift as it reflected that the economy was at four and a half times the level it was in 1948. The UK is also robust in the manufacturing sector as it is actively involved in the petroleum, automotive among other sectors. It’s service sector is also noted to be stable as it well supported by the financial and Telecommunication sector (Heizer 45).
France
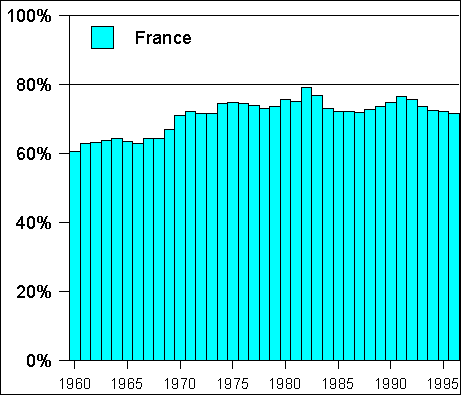
We can see that although the French GDP seems to be fluctuating, it seems not to follow any specific pattern. After Jacques Chirac became president in 1995, the GDP and economy at large seems to have improved and this is attributed to the rise in the manufacturing sector and the service sector. France has heavily invested in the petroleum sector. After the oil crisis in 1973 and 1978 the GDP dropped affecting both businesses and homes (Heizer 96).
Conclusion
All these countries had different levels of GDP growth but in general all the economies grew as from 1970 to the late 2000 era. From Europe to Asia up to North America, the services and manufacturing sector grew at a steady rate to reflect the growth in the economies (Heizer 63).
Works Cited
Heizer Jay. “Operations Management.” London: McGraw- Hill, 2009.