Introduction
The economic history of economic condition of a country shows the country’s present economic status, and the economic well being of the country. With the economic recession the world economy has been facing crisis regarding their GDP growth, inflation, current account balance, and unemployment rate (UN, 2008). This paper aims to understand the economic backdrop of Kazakhstan and its economic history. Kazakhstan gained its independence from the Soviet Union in 1991and World Bank believes it was one of the earliest and most vigorous reformers among the CIS countries (World Bank, 2009).
So it will be interesting to trace the historical transformation of the GDP of Kazakhstan which has undergone various economic and political upheavals. For this the paper studies the country’s historical macroeconomic data to ascertain the performance of the country. The paper will discuss the historic GDP and its trend since 1991, after the independence of the country from Soviet Union. Then the paper will also try to find out the reason for the fluctuations (if any) in the GDP. The paper will also review the economic and monetary policy of the country in order to ascertain the policy impetus taken by the government to bring about development in the country.
National Account of Kazakhstan
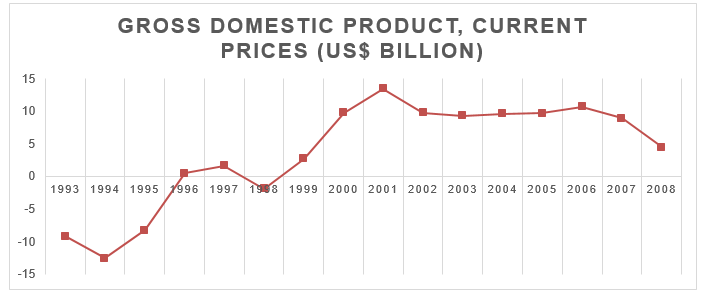
In this section I will discuss the GDP of Kazakhstan and the trend of the same from 1992 to 2008. The gap in GDP is ascertained through the gap in the trend of GDP with the actual GDP of the country. This gap is shown in figure 1. The graph shows that the GDP was below the trend level from 1992 to 1996. The negative gap in GDP can be attributed to the difficulty the country went through during the transition process. From 1991 to 1995 GDP fell by 30 percent where the GDP growth showed constant negative trend (IMF, 2009). Thus there was a fall in the GDP growth rate which was negative and it declined further from -9.2 percent in 1993 to -12.58 percent in 1994 to -8.26 in 1995 (IMF, 2009).
The reason was in the collapse of the export and the hyperinflation which was caused due to fiscal and external imbalances which reached the height in 1994 (World Bank, 2005). Further due to the independence and the regional political upheaval in the region, production ties with the CIS countries were severed which created enormous unemployment. Further there was a collapse of the exports of the CIS countries and livestock became the only means for livelihood for the rural population (World Bank, 2005). But after 1995 the economy is seen to recover and the GDP gap becomes positive from 1996 to 2007 with a year negative trend in 1997-98.
This period of positive GDP gap was market by the government’s aggressive effort to attain investment in mineral and energy resources and provide opportunity for the country’s relatively educated population (World Bank, 2005).
This era was market by an increasing foreign direct investment (FDI) in the country. From 1994 to 1996 the country underwent a liberalization process wherein the country imposed hard budget constraints on the banks and companies and privatized most small and medium scale enterprises. Further the oil sector was primarily exploited from 1996 when the GDP started growing. World Bank data shows that the there is a significant gap between the non-oil and oil GDP where the latter is seen to be significantly high. The stability was achieved through capital inflow in form of FDI. Strong monetary and fiscal policy led to increased FDI, as well as a strong supply side especially in natural resources helped the gap become positive.
So the gap is seen to become positive and maximum in the period of 1999 to 2001. Since 2001 the country has posted inflation below 10 percent and there was stability in the national currency against US dollar (World Bank, 2005). As is shown in figure 2 (A), which shows that since 1998 the inflation has around 10 percent and since 2001 it has subsided below 10 percent till 2007. This shows why the gap in GDP had declined considerably.
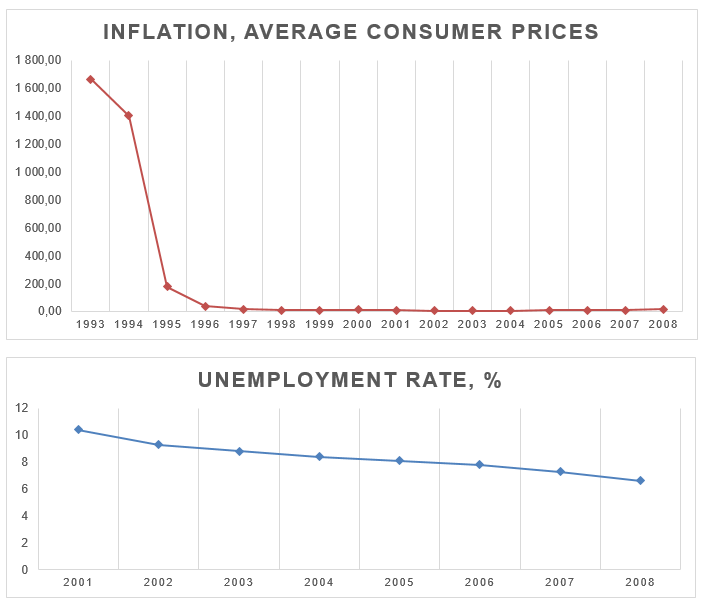
A further analysis of the unemployment rate in Kazakhstan shows that the unemployment rate has declined since 2001 to 2008 as shown in figure 2(B). The rate of unemployment has been declining showing a decline and this is reflected in the increasing GDP and positive gap in GDP. Figure 2(B) shows that the unemployment rate which increased from 10 percent in 2001 to 6.6 percent in 2008. Thus, both unemployment and inflation created a positive pressure on the GDP of the economy.
The balance of payment (BoP) situation of the country is presented in the figure below with the current account balance being traditionally negative since1992 to 2006 with few instances of the current account balance becoming positive. Current account balance shows the country’s difference in export and imports. This shows that the dependence of the country on import of goods and services which indicates that the country is far from being self sufficient. This indicates that the balance of payment of the country though was going through negative current account balance in the 1990s, started recovering in the 21st century, with the balance becoming positive after 2007.
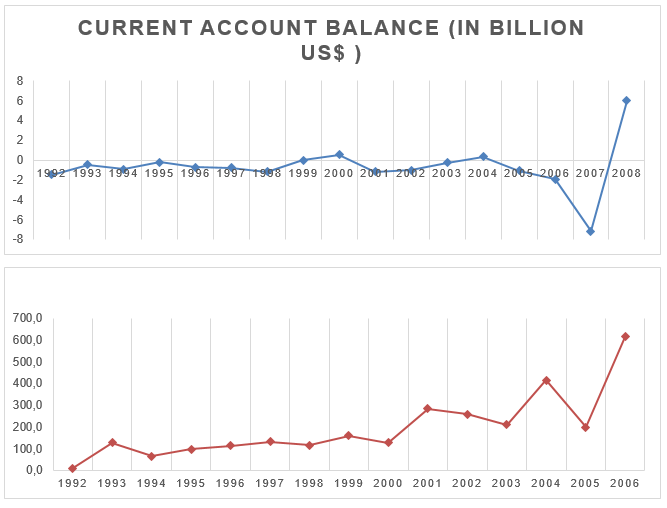
The reason for this can be found in the consolidated financial statistics of Kazakhstan. The net borrowing for the country has been negative since 2001 but it was maximum in 2007 (Agency of Statistics, Kazakhstan, 2009). This indicates that the borrowing from international sources forced the current account balance to dip further below -6 percent mark, indicating a negative BoP. The foreign direct investment flow into Kazakhstan shows that the flow has been low in the immediate aftermath of the independence of the country in the early 90s, but it started increasing sporadically after 2000. This is shown in figure 3 (b) which demonstrates the FDI flow in Kazakhstan in the post independence era.
From the above discussion on the national account statistics of Kazakhstan it can be derived that the economy though was in shambles in the post-independence era, has been growing fast due to the liberal structural, economic and monetary policies that the government has undertaken. There is a high degree of modernization which has been facilitated by a high degree of commodity prices, but the country needs to boost its economic activity outside mining and metals. Even though there is an increase in the secondary and tertiary sector of the economy, but the major impetus is from the mining of oil and high oil investments and spending. World Bank statistics show that 80 percent of the GDP is from oil and gas, mining and metals (World Bank, 2005). This indicates that the weak manufacturing base will hamper the further growth of the economy.
Fiscal Policy
Fiscal policies are the main channel through which an oil boom finds its outlet into the economy. The taxes are high as the income from oil is high and so the budget is always positive. There are also fiscal add-on effects as there is an increased consumer good import.
Further there is a fiscal policy which restricts aggregate demand. Since 2004 a tight fiscal policy has been abandoned, with the only one third of the oil income are to be saved and the government debt is to be considered a part of the GDP. Further there have been tax reductions in 2004, especially for non-oil income which increased the non-oil deficit. The tax reduction was across the board which included VAT and social tax. Further targeted tax reductions were also introduced. But World Bank believes that there are more requirements for budget disciplining of the fiscal policy as well as on the quality of public spending.
Monetary policy
Traditionally the exchange rate regime was present in Kazakhstan. But in 1994 the stabilization of exchange rates became a strong monetary policy which established an almost fixed exchange rate (World Bank, 2005). This policy was maintained through various crises like the East Asia crisis of 1997 and the Russian crisis of 1998 even though Ruble was devaluated in the mid-1998. This fixed exchange rate regime was a mistake because there was a huge devaluation of the national currency against Ruble which reduced the country’s competitiveness. This overvaluation of exchange rate led to a floating rate which ultimately led the country to recession in 1999.
For this reason presently the National Bank of Kazakhstan (NBK) is hesitant in declaring an exchange rate target (World Bank, 2005; NBK, 2009). Presently NBK aims to target inflation to maintain monetary intervention instead of stabilizing the nominal exchange rate and thus offsetting the intervention process through a few sterilized interventions. Further NBK has also tried to buy a large amount of reserves while issuing domestic debt. This increased the outstanding NBK notes from minimum in 2001 to 5.2 billion in 2005 (World Bank, 2005). This shows the inconsistency in the monetary policy and the aim of the country.
Conclusion
In conclusion it can be stated that the economy of Kazakhstan is highly dependent on mining and natural resources. Thus the stress is more on the primary sector. But for development of the economy, there must be a shift of income and employment into the secondary and tertiary sector. But this is not happening in Kazakhstan as the dependence on income from oil and gas is very high. Thus, even though the GDP has shown significant growth but the nature of development is constricted. Further the further fiscal and monetary policy are restrictive and to a great extent unsure. So the development process requires further economic impetus from the policy makers.
Bibliography
Agency of Statistics, Kazakhstan, 2009. AGENCY OF STATISTICS REPUBLIC OF KAZAKHSTAN – Labor. Web.
Agency of Statistics, Kazakhstan, 2009. National Accounts. Web.
IMF, 2009. Kazakhstan – Data and Statistics. Web.
NBK, 2009. National Bank of Kazakhstan. Web.
UN, 2008. UN IN KAZAKHSTAN – STATISTICS. Web.
World Bank, 2009. Kazakhstan – Country Brief. Web.
World Bank, 2005. Republic of Kazakhstan Country Economic Memorandum. Country report. World Bank.