Introduction
Violent crime is a highly relevant issue in the United States. It affects many cities across the country, and it is important to conduct a thorough analysis to understand the degree of the problem. Moreover, examining violent crime statistics can help develop practical solutions to improve national safety. Ultimately, this paper compares homicide statistics for New York City and Los Angeles using FBI data to determine which city is better to move to.
Data Collection
The information on murders in the two cities is based on data provided by the respective police agencies. Figure 1 below suggests that the overall number of violent crimes is higher in New York, while the trends are relatively similar. It is important to note that the data concern only homicides, so the distribution of other crimes might differ between New York and Los Angeles. The information is obtained from the respective police agencies, which include the New York City Police Department and the Los Angeles Police Department.
Although both institutions collect crime data on reported and cleared homicides from various city areas, the present chart focuses exclusively on reported cases. The measurement of homicide is fairly accurate because the crime’s definition, unlike many others, is very specific. Therefore, it is safe to assume that the data provided by the police agencies is credible and reliable.
Several conclusions can be drawn from the chart on the homicide rates. First, there are more murders in New York City than in Los Angeles. This information is critical, though it does not reveal all the details, as the populations of the two cities differ greatly.
Namely, according to the recent census, New York City has approximately 8,500,000 people, while around 4,000,000 residents live in Los Angeles (The Official Website of the City of New York, n.d.). Hence, while more murders occur in New York, the homicide rates per person are actually higher in Los Angeles, which will be further discussed later in the paper.
Secondly, the chart demonstrates the number of homicide cases for each year in the 2012-2022 period. This information is valuable because it helps determine trends and understand external causes of murder. Unfortunately, the FBI’s Uniform Crime Reporting data does not include 2021 homicide statistics, which makes the analysis more challenging.
However, it is plausible to assume that the general trend in New York has been downward since the pandemic: 468 in 2020 and 438 in 2022. On the other hand, the tendency in Los Angeles is the contrary: 351 in 2020 and 387 in 2022. It is reasonable to wait for official 2023 data, but some sources indicate that homicide rates were even lower in 2023 for both cities (Levenson & Morales, 2024). In summary, visual data can help people understand crime trends and make educated decisions.
Finally, it is possible to estimate the year-to-year progress in crime prevention. For example, based on the data, the number of homicides in New York City has decreased by approximately 6.8%, while the number of murders in Los Angeles has increased by around 10% since 2020. It is possible to make such calculations for each year to understand whether some external events, such as the pandemic, affect violent crime.
Supporting Evidence
Following the analysis of official FBI databases, it is important to investigate how news reports cover events and present homicide statistics. They can help reveal critical insights into the topic and present new ideas about why crimes occur in the cities. Moreover, news reports can provide helpful information that supplements official data. The present assignment analyzes three articles on violent crime statistics in Los Angeles.
Report Analysis
The first article concerns recent crime statistics, specifically the decrease in homicides in 2023. In the Los Angeles Times, Jany (2024) reports both data from the Los Angeles Police Department and statements by the LA Chief, Michel Moore. According to this information, the homicide rates in Los Angeles dropped significantly in 2023 (8.7 per 100,000) compared to 2021 and 2022 (~10.3 per 100,000) (Jany, 2024). However, there were still many concerns regarding public safety and gun violence.
For example, less than half of all homicides were gang-related, meaning that multiple crimes occurred on an individual basis (Jany, 2024). There were also other problems, such as excessive use of firearms by the police, who opened fire thirty-four times in 2023 (Jany, 2024). In summary, the article explains that even though the homicide rates decreased in 2023, safety concerns are still relevant in Los Angeles today.
Examining historical trends is an effective strategy to understand the causes of crime. The second article by Stallworth and Manthey (2022), published in ABC7, examines crime statistics in Los Angeles from 2010 to 2022. Based on these findings, the homicide rates in 2021 and 2022 were the highest in the decade, and the use of guns as murder weapons was also the most prevalent (77% in 2022) (Stallworth & Manthey, 2022).
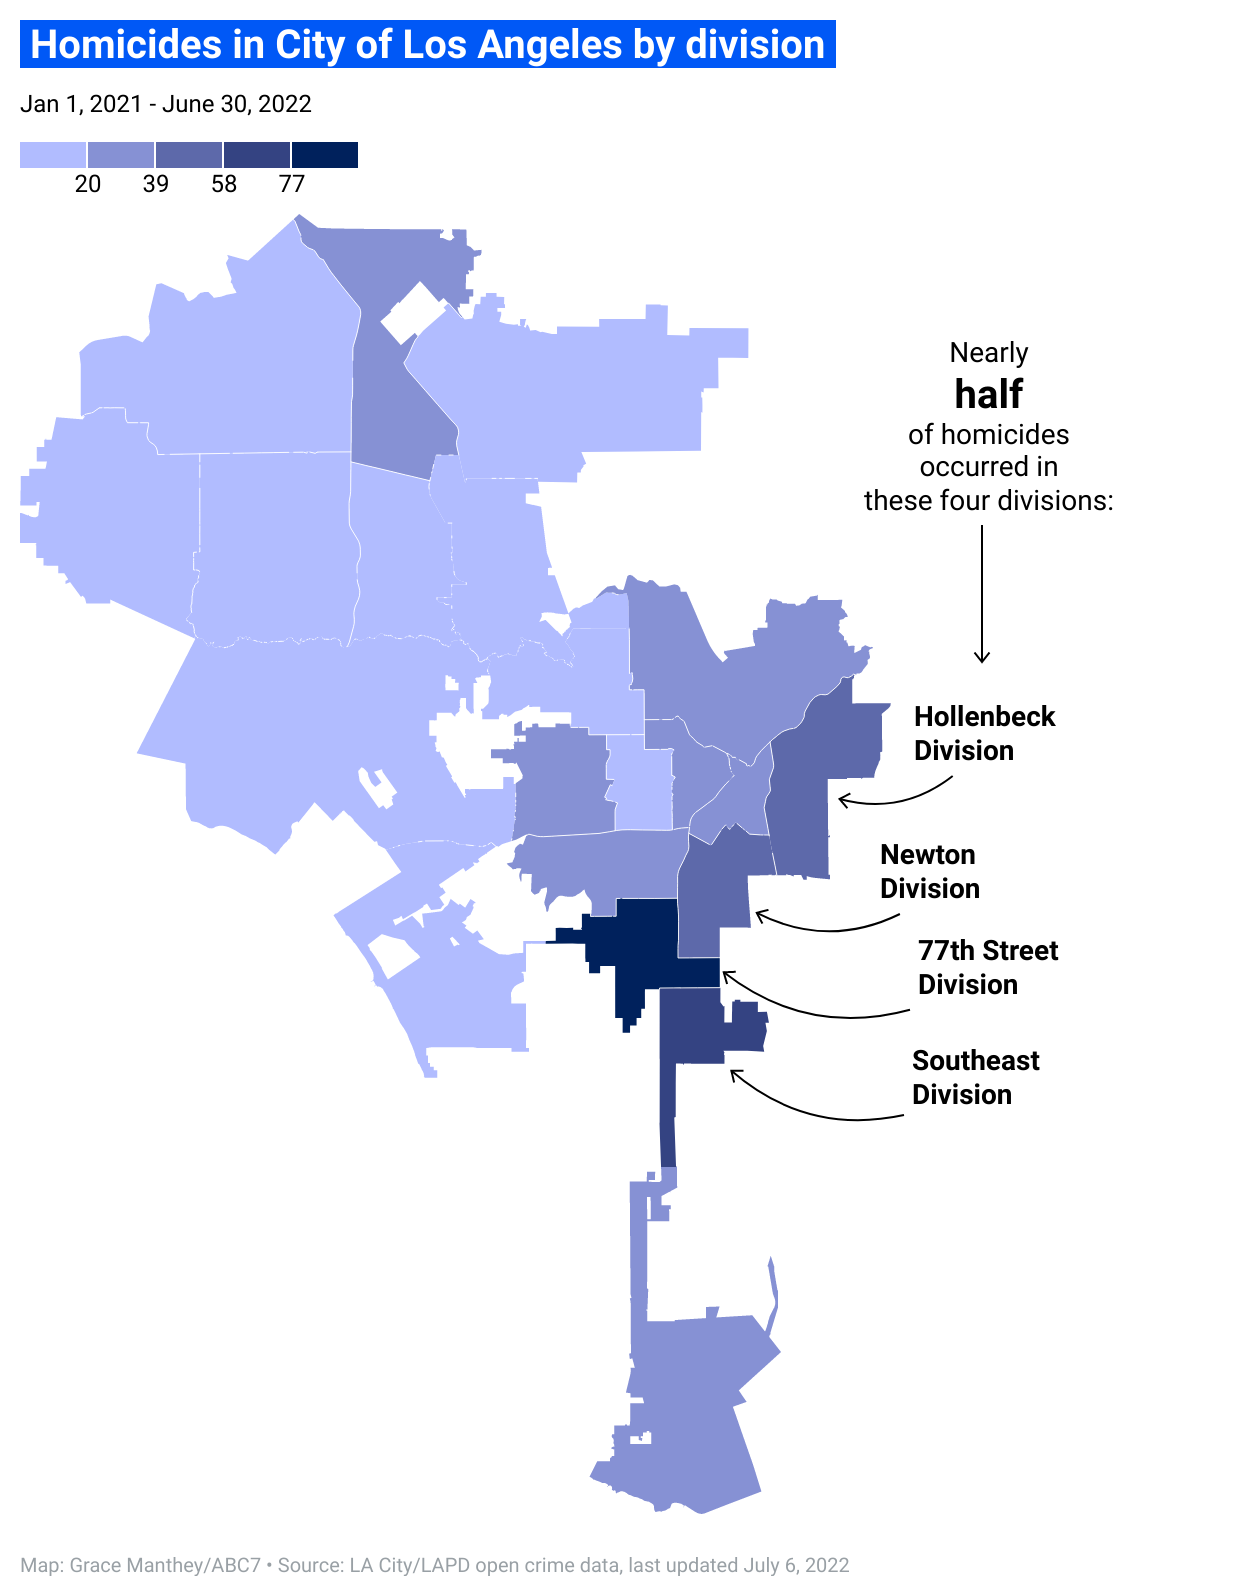
On the other hand, the authors presented that the number of guns purchased reduced significantly from 2.4 million in 2016 to 1.5 million in 2021 (Stallworth & Manthey, 2022). It means that the relationship between firearm ownership and violence is not directly positive, and other variables are significant. Moreover, the authors visualized homicide statistics for 2021-2022 using a hotspot map that shows the areas with the highest numbers of killings (see Figure 2). Finally, Stallworth and Manthey (2022) found that homicide rates increased significantly from 2019 to 2020, but other crime types were less frequent. This information is helpful for cross-comparison among illegal activity categories and for identifying the causes of crime.
The third article in NBC Los Angeles takes a different approach, analyzing crime in Los Angeles by examining how people perceive public safety and the LAPD. A 2023 survey of 1,751 residents found that most had a positive perception of the Los Angeles Police Department (Lopez, 2023). However, there were several critical issues, such as racial profiling and potential police brutality. People of various races and backgrounds were concerned about these problems, making it a more significant issue than high homicide rates (Lopez, 2023).
There was also a question of the police budget, as funding for the LAPD increased in 2021-2022, while funding for social services and the homeless remained relatively the same (Lopez, 2023). According to the survey, these problems were relevant for Los Angeles residents and overshadowed long-standing issues, including homicides and violent crimes. In summary, analyzing news reports reveals diverse perspectives on crime and its causes.
Incidence Rate Analysis and Comparison
Finally, it is critical to evaluate the homicide incidence rate, as this metric is more illustrative of public safety than the number of cases. Furthermore, it is appropriate to compare the data with media reports to verify the information and its validity. Table 1 below presents the general statistics on crime in New York and Los Angeles, including the range, % changes, the mean, and the median. Consequently, Figure 3 below presents the homicide incidence rates, calculated as the number of cases per city population multiplied by 100,000.
Table 1 – Homicide statistics: Number of cases in 2012-2022
Comparing the incidence rate chart with the number of cases (Figure 1), it is evident that the two metrics differ significantly. Although there are more homicides in New York, the rate per 100,000 residents is lower because the total population is considerably higher. The visualizations are consistent with the media reports as well because most authors use official data in their articles (Jany, 2024; Stallworth & Manthey, 2022). Unfortunately, the FBI’s Uniform Crime Reporting statistics do not yet include 2023 homicide data, but the overall trends match.
Discussion
Cross-comparing information from multiple sources can enhance the credibility of the findings. In this case, the core results imply that the incidence rate of homicides is higher in Los Angeles than in New York. Besides, the media report by Stallworth and Manthey (2022) indicates that some areas, such as the 77th Street Division, are particularly susceptible to violent crime (see Figure 2). Together, these findings can help people decide where to settle if the homicide rate is a critical factor. Finally, since the information from various sources matches, the data is generalizable and illustrative of real life.
Conclusion
Based on the present analysis of the two locations, I would prefer to move to New York City mainly because the homicide incidence rate is lower. Violent crime is a highly concerning issue for me, and I believe that public safety is one of the most illustrative metrics of quality of life. For this reason, I would use the homicide incidence rate variable to guide my decision on where to move. The current analysis defends my position because even though the number of cases is higher in New York, the likelihood of getting assaulted is lower.
Finally, I would supplement my decision by looking at what areas in New York are safer. As seen in Los Angeles, some areas are more dangerous than others. Therefore, I would conduct additional research on New York City to ensure I move to the safest neighborhood with the lowest violent crime rate. In summary, the present assignment taught me valuable insights into how data can guide decision-making, and if I had to move, I would choose New York City.
References
Federal Bureau of Investigation. (n.d.). Crime data explorer.
Jany, L. (2024). L.A. officials tout double-digit drop in violent crime in 2023. Los Angeles Times.
Levenson, E., & Morales, M. (2024). Homicides dropped by over 10% in America’s biggest cities in 2023. CNN.
Lopez, L. (2023). New survey shows LA residents concerned, yet supportive of LAPD. NBC Los Angeles.
Stallworth, L., & Manthey, G. (2022). Homicides in Los Angeles reach highest level in 15 years during 1st half of 2022: Report. ABC7.
The Official Website of the City of New York. (n.d.). Twenty-five largest U.S. cities by population: General and economic information. NYC.