Introduction
In defining homosexual marriage, anthropologists formulate valid cross-cultural variations of modern and traditional forms. Same-sex marriage, just like any other form of marriage, is a union of two adults, though of the same sex, in a domestic arrangement with each member having defined roles to play. Over the years, homosexual couples have raised debates in conservative American society (Baker, 2010).
Specifically, religious and conservative groups have been the most active in opposing homosexual couples getting married (Hunter, 2012). Despite these divergent opinions, homosexual couples have spread across several states of the USA and are now legal in the states of Iowa, New Hampshire, Connecticut, Vermont, and Massachusetts (Sherkat, Vries & Creek, 2009). There is a need for the magnitude of how gender, race, and religious perceptions have an influence on same-sex marriages.
Existing Literature
Specifically, religiously-based opposition has constantly and openly fought against this practice. Through empirical research involving 320 respondents from mainstream churches and protestant churches with equal representation, Baker (2010) indicated that 80% of respondents from Protestant churches opposed same-sex marriage, citing religious conflict and bad influence it has on society as compared to 63% of respondents sharing the same view from mainstream churches in a sample of 320 religious respondents (Baker, 2010).
Ethnicity or race has a direct influence on individual perception of homosexual couples and same-sex marriage. Through mixed research and social surveys carried in 2009, Sherkat, Vreis, and Creek (2009) established that the racial divide has a direct influence on the perception of homosexual couples.
Through survey interviews involving 180 participants from the white and African American communities with equal representation, Sherkat, Vreis, and Creek (2009) resumed that 70% of the respondents of African American origin opposed homosexual marriage as compared with the 30% opposition by the white American ethnic groups. Specifically, within the African American respondents, the main reason for this opposition was cited as conservative family norms and Protestantism faith, which cannot accommodate same-sex marriage.
The male gender is more likely to oppose same-sex marriage than females when all the other factors are held constant. Through a case study research, Hunter (2012) found out that 67% of the male respondents opposed the view of homosexual couples as compared 47% of female respondents in a sample space of 200 (Hunter 2012). The author noted that the main reasons for strong opposition from the male gender were in the conflicts of gender roles since the traditional marriage define couple as a man and a woman who have specific roles to fulfill (Hunter 2012). A self-regulating society offers a facilitated explanation for the gender differences in support for same-sex marriage.
Apparently, the existing literature suggests that race, gender, and religion have an impact on perception towards same-sex marriage in the US. Specifically, the results displayed an existing correlation between same-sex marriage and the three variables of gender, religion, and race. Therefore, the research question for the proposed research is;
- What is the magnitude of the correlation between same-sex marriage and variables such as gender, race, and religious perception?
Data and Method
Variables
The dependent variable in this research paper is same-sex marriage. Specifically, the research paper will examine the independent variables of religious affiliation, race, and gender that have an impact on the attitude towards same-sex marriage. Through reviewing the relationship between same-sex marriage and these independent variables, it is possible to determine the degree to which the aspects of gender, race, and same-sex marriage in the United States of America. These variables are valid measures of the perception towards same-sex marriage since they capture the perceptional factors at individual and group level towards same-sex marriage (Gerring, 2005).
Hypothesis
In order to capture a comprehensive understanding of the perspectives related to same-sex marriage, it is essential to reflect on the factors that influence same-sex marriage among young adults in America.
The first hypothesis of this reflective study is that individuals raised in a loose religious foundation are more likely to support same-sex marriage than individuals raised in the normal traditional religious family.
- Null hypothesis: Religious beliefs do not have an impact on homosexual sex relations.
- Alternative hypothesis: Religious beliefs have an impact on homosexual sex relations.
The second hypothesis of this study is that race influences the perception of homosexual couples becoming legally married couples.
- Null hypothesis: Race does not influences influence perception of homosexual sex relations.
- Alternative hypothesis: Race influences perception of homosexual sex relations.
The last hypothesis is that the support and opposition of homosexual couples vary with gender in America.
- Null hypothesis: Gender does not influence homosexual sex relations.
- Alternative hypothesis: Gender influences perception of homosexual sex relations.
The design of this research was secondary data from the survey done by the National Opinion Research Center (NORC). Through social survey, the semi structured, interpretative, sample-based, and comparative in-depth interviews with key respondents was done over a period of two years from 2013 to 2014. Through qualitative data analysis, the study revealed an explicit relationship between same sex marriage and the variables such as gender, religion and ethnicity.
Data will be collected for four variables. These are homosexual sex relations, gender, race, and religion. The data were collected from 2538 respondents in the year 2014. The first variable that will be analyzed is gender. It is measured in terms of
- male;
- female.
The second variable is race. Ordinal data are collected where 1 represents white, 2 for black, and 3 others. In the data zero represents IAP. The third variable is religion. In the data set, 0 represents IAP, 1 for Protestants, 2 for Catholic, 3 for Jewish, 4 for none, 5 for others, 6 for Buddhism, 7 for Hinduism, 8 for Other Eastern, 9 for Moslem, 10 for Orthodox, 11 for Christian, 12 for Native American, 13 for Inter-nondenominational, 98 for DK, and 99 for NA. The final variable is homosexual sex relations. In the data, 0 represents IAP, 1 for always wrong, 2 for almost always wrong, 3 for sometimes wrong, 4 for not wrong at all, 5 for others and 8 for DK.
Univariate analysis
The analysis will focus on providing the frequency distribution table of the variables, histogram and descriptive statistics. The outcome of the univariate analysis is presented below.
Frequencies
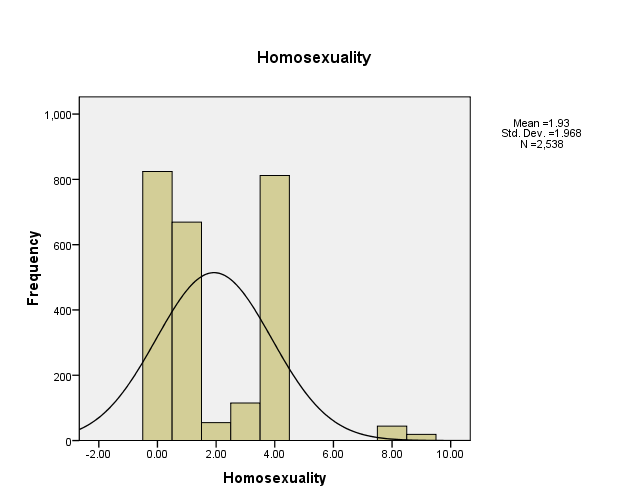
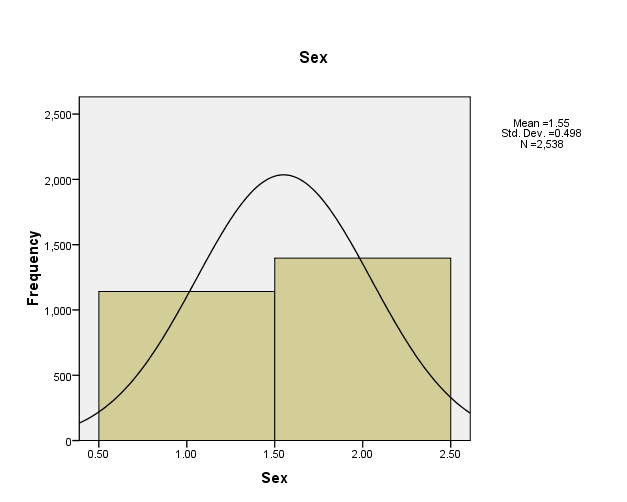
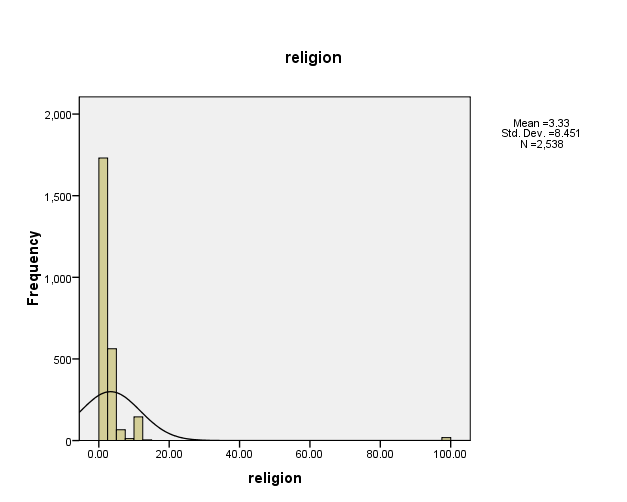
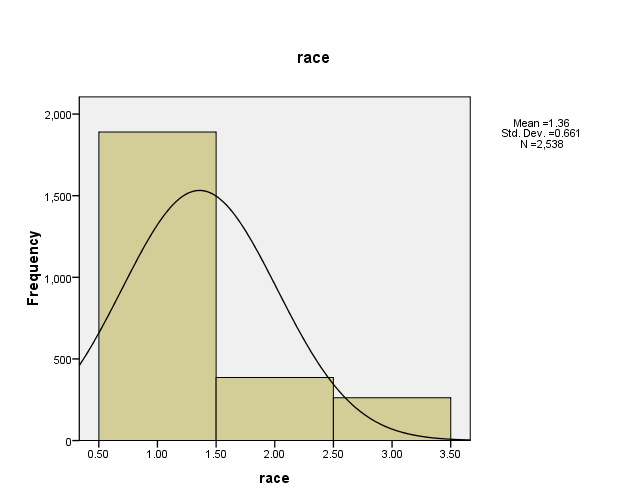
Histograms
Descriptive statistics
Discussion
Under homosexual sex relations, ‘not wrong at all’ has the highest frequency. For religion, Protestants have the highest frequency. The whites have the highest frequency in the data set while the female has the highest frequency in the data set. A summary of the descriptive statistics is shown above.
Bivariate analysis
Regression analysis will be used to establish if there is a relationship between homosexuality and the variables. Thus, homosexual sex relations will be the dependent variables while gender, religion and race will be the independent variables. The regression line will take the form presented below.
Y = b0 + b1X1 + b2X2 + b3X3
- Y = Homosexual sex relations
- X1 = Sex
- X2 = Race
- X3 = religion
Results
Coefficients
ANOVAb
Model summary
Analysis and interpretation
Based on the results presented in the table above, the regression equation can be written as Y = 1.549 + 0.262X1 -0.052X2 + 0.013X3. The coefficients imply that there is a positive relationship between homosexual sex relations and two independent variables. These are gender and religion. A negative relationship exists between the independent variable and race. The t-statistics show that gender and religion are significant determinants of homosexual sex relations at the 5% level of significance while race is not a significant determinant. The F-test in ANOVA shows that the overall regression line is significant.
However, the R-square is 0.008. This shows that the regression model is weak. That is, the independent variables do not explain the variations in the dependent variable. The results show that gender and religion are significant determinants of homosexual sex relations. This implies that the first and the third hypothesis hold while race does not explain homosexual sex relations.
Summary and conclusion
In the first hypothesis, the number of religious persons observed as supporting strongly supporting sex marriage was 26.9% as compared to 25.1% of the non religions persons who strongly opposed same sex marriage. This led to the rejection of this null hypothesis. It implies that religion affects perception of same sex marriage.
In the second hypothesis, the number of whites observed as supporting strongly supporting sex marriage was 1539 respondents as compared to 493respondents of the non-whites who strongly opposed same sex marriage. Thus, the null hypothesis will not be rejected. This implies that race does not have an impact on homosexual sex relations.
In the last hypothesis which stated that the support and opposition of homosexual couples vary with gender in America, the findings indicated that the male members of the society are more likely to oppose same-sex marriage than the female gender. This led to the rejection of this null hypothesis. This implies that gender affects homosexual sex relations.
Same sex marriage has elicited opposition and support in the American society. The findings indicated that the variables of gender, religion, and race determine the perceptions of an individual towards this union. Generally, the male gender showed stronger opposition to this union than the female gender. Besides, the whites supported same sex marriage more than the non whites. In addition, religious persons strongly opposed same sex marriage by a higher magnitude than the non religious persons. The concerns raised by those who opposed this union included ethical concerns, changed family roles, and bad influence on the society.
The first hypothesis of this reflective study was that individuals raised in loose religious foundation are more likely to support same-sex marriage than individuals raised in the normal traditional religious family. This research was founded upon the study by Baker (2010) which concluded that individuals raised in loose religion with the parents being homosexuals are likely to support same-sex marriage and may end up as homosexuals in adulthood. Same as the findings of Baker (2010), the research by the National Opinion Research Center indicated that the religious persons opposed same sex marriage by higher magnitude than the non religious persons. Apparently, the variable of religion is an indicator of an individual’s perception on same sex marriage.
The second hypothesis of this study was that ethnicity influences the perception on homosexual couples becoming legally married couples. This confirms the study by Sherkat, Vreis, and Creek (2009) which indicated that African American and the Latino ethnic groups had more opposing views on homosexual couples than other ethnic groups in America. Same as the findings of Sherkat, Vreis, and Creek (2009) the research by the National Opinion Research Center indicated that non whites opposed same sex marriage by higher magnitude than the whites. Apparently, the variable of ethnicity is an indicator of an individual’s perception on same sex marriage.
The last hypothesis was that the support and opposition of homosexual couples vary with gender in America. This confirms the study by Hunter (2012) which found out that 67% of the male respondents opposed view of homosexual couples as compared 47% of female respondents. Same as the findings of Hunter (2012), the research by the National Opinion Research Center indicated that males opposed same sex marriage by higher magnitude than the females. Apparently, the variable of gender is an indicator of an individual’s perception on same sex marriage.
References
Baker, B. (2010). Same-Sex Marriage and Religion: An Inappropriate Relationship. e- Research, 1(3). Web.
Gerring, J. (2005). Case study research. New York, NY: Cambridge University Press.
GSS Data. (2016). General social surveys. Web.
Hunter, N. (2012). The future impact of same-sex marriage: More questions than answers. The George Town Law Journal, 100(1), 1855-1879.
Sherkat, D., Vries, K., & Creek, S. (2009). Race, religion, and opposition to same-sex marriage. OpenSIU Journal, 91(1), 80-98.