Introduction
Managing and leading people is one of the tasks that are very much challenging, many managers and leaders in the organization have faced many challenges when dealing with the people they lead. Managing and leading people is not that easy since one has to deal with different people from different backgrounds, it means that as a manager one has to understand the different issues related to these people in order to perform the work effectively.
Challenges associated with managing and leading people to call for managers to be keen to observe different factors regarding the people in order to come up with a better way of ensuring that people work effectively and that there are no high rates of absenteeism reported.
Discussion
At the call center, the manager has problems in regard to the high rates of absenteeism that affect the performance and the operations within the call center. This calls for investigations in order to establish the departments with high rates and the reason behind this; this will help in making viable decisions concerning the situation. In order to come with viable information, primary data was used in the study. The data was collected from the call center management; the information provided by the manager was from the records that are kept regarding the people who report for the job daily. The report used was based on the last twelve months; the reason for choosing these data was because of the long period it covered since it would provide viable information. The data also covered nearly every person in the call center, the reason for choosing data that involved many different personnel people in the call center was because of the viability that is brought by diversity. This would enable us to come up with an accurate and well-informed decision based on the issue at hand.
Based on the data collected the cases of absenteeism are highly reported, it is like nearly every day there is a person who does not report for work. In order to establish the rates of absenteeism in different departments, the data will be divided according to different departments and it will be analyzed based on that department. This will help in establishing the departments that are highly affected hence be able to know what exactly the reason for this is.
In order to analyze the data effectively different analysis techniques will be used that will help to understand the data and draw up certain findings that will enable us to make informed decisions on the problem. An analysis of the data collected quantitative analysis technique was employed, the reason for using this technique is to help establish the relationship between the rate of absenteeism and the managing and leading problems that are associated with it.
The different departments were involved in the study in order to come up with viable information. An analysis was made on the following departmental positions managers in different departments, clerical positions, supervisors, unskilled personnel, semi-skilled positions, administrators, and technical personnel. Personnel in every position were examined and their absenteeism within the period of one year was analyzed.
Data analysis
Data collected was analyzed by use of both qualitative and quantitative methods, the reason for using the two data analysis methods is that after the interpretation of the data using quantitative methods then it was discussed using qualitative techniques. The quantitative data analysis method used was Excel whereby tables and pie graphs were used to interpret the data into percentages that would give a clear understanding. The reason for choosing Excel is because it is easy to use and makes clear interpretations of the data. The findings of the data interpretation would form the conclusions and relevant decisions were made from the findings.
An analysis of the data tables and pie charts was highly used because of the simplicity of use as well as provision of relevant data.
Table 1: Managers
The table above represents an analysis of absenteeism of managers at the call center, based on the data it is clear that within the period of one year. The call center manager was absent for work for days, while the human resource manager and warehouse managers attended to their duty full time through the one year. The total days for the managers are two days for the whole group. This shows that the managers are committed to their work and the cases of absenteeism are not out of the personal will.
Table 2: Clerical positions
Based on the analysis made on the clerical positions it is clear that in the three positions cases of absenteeism have been reported. The positions in which there are many people not reporting to work throughout the year are the department of call center operators. In these positions, there are many people and the rate of absenteeism is very high. The rate of absenteeism ranges from three days to nine days in this particular group of personnel.
On the other hand, the group of customer service clerks also has reported cases of absenteeism, though there are no many people in this group the rate of absenteeism is very high. It ranges from eight days to thirty-six days per year, this represents the highest number of days of absents among this group of clerical personnel. The other group is the IT helpdesk officers; they represent the lowest number of people among the clerical personnel. They too have contributed much to rates of absenteeism among the clerical department, the rate ranges between four to six days per year.
This is just one of the personnel groups in the call center and the rate of absenteeism reported in this group is very high. It shows that this group is vulnerable to absenteeism and falls up should be made by the manager to establish the reason as to why the cases of absenteeism are very high in this particular group and especially among the customer service clerks. Also from the analysis males are contributing a larger number of the reported cases of absenteeism as compared to females. It shows that there may be a reason related to male absenteeism at work.
In order to determine the actual rate of absenteeism in this group of personnel mean was calculated in order to determine the average. The mean as per the data is 10.75 that is rounded off to 12, it means that at least the total number of personnel in this department do not report for work at least one day every month. This translates to high rates of absenteeism in the department.

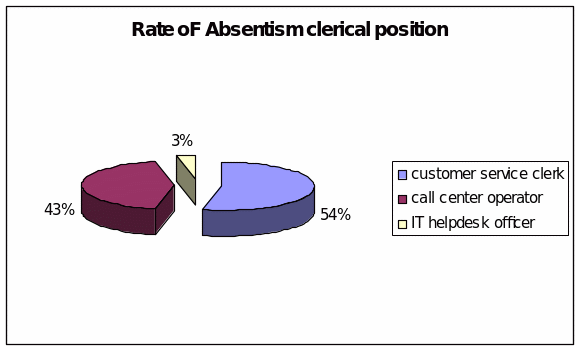
The pie chart represents the different rates of absenteeism among the group; the group consists of three groups of personnel. From the pie chart, it is clear that the group that is highly affected is the customer service clerks with a percentage of fifty-four, followed by call center operators with forty-three percent and the IT helpdesk officer with three percent. It means that for the customer service clerks who have the highest percentage of absenteeism the days they are absent for work are many as compared to the days they report for work. The factors contributing to high rates among the customer service clerks should be looked into and ways of solving and minimizing the rates of absenteeism established.
Table 3: Supervisors
From the analysis of the data on supervisors, it is clear that the rate of absenteeism is not very high. Among the warehouse supervisors, one of them did not report for work for two days in the whole year while the other one was ever-present. While among the cal center supervisors three of them were absent for at one to four days during the year, while one of them was ever-present for work. As compared to the clerical group this group has very low rates of absenteeism.
Also, the people who report the cases of absenteeism in this group are young people aged around twenty-three years. And almost all of them belong to the call center supervisor position. Investigations should be made as to what is causing the absenteeism, especially among the call center supervisors.
Table 4: Unskilled personnel
The group of unskilled personnel consists of cleaners both female and male, from the analysis it is clear that the rates of absenteeism are also very high in these groups. The rate ranges from eight to twenty-five days in the whole year. Every one of them at least has a record of absenteeism. The mean of the total number of days the group has reported absenteeism is fifteen, this means is very high and it means that though the people in this group are not very many the rates of absenteeism are very high. It shows that there are certain factors that are contributing to the high rates of absenteeism in this group investigations need to be carried out to establish the cause.
Table 5: Semi-skilled
The semi-skilled group of workers has two categories that are the warehouse personnel and the packers. Based on the above data on the table there are high rates of absenteeism recorded in this group. The rate of absenteeism ranges between three and twenty six days during this period. From the data it is evident that both male and female personnel have almost equivalent absenteeism cases.
From the data it seems that the semi-skilled group consist people of different ages who hold two positions the warehouse person as well as the packers. The highest absenteeism rate is recorded among the young employees as compared to the older people. Employees between ages of thirty five and twenty have the highest numbers of absenteeism recorded, while the other higher ages have lower rates of absenteeism recorded. This means that there is a reason or contributing factor to the increased absenteeism rates among the young employees as compared to the older ones hence the reason for investigation for the reason to this.
Though the two groups of people have higher rates of absenteeism the warehouse personnel have a higher rate of absenteeism as compared to the packers. The total days the warehouse personnel are reported to be absent the whole year is one hundred and fifty two days while for the packers is ninety five days. The mean is 14.5 which is a very high figure meaning that the rate of absenteeism is also very high in this department.
Clear analysis between packers and warehouse persons shows that there is a problem with the warehouse personnel that is contributing much to the high absenteeism rates. The manager should investigate the reason as to why the absenteeism rates among the warehouse personnel are very high.
Table 6: Administrator
The group of administrators is comprised of Human resource officers also they have reported cases of absenteeism ranging between three to five days for the whole period. Here it seems as if age does not play as significant role in the rates of absenteeism, though the officer with the higher age has the highest absent days for work. The mean average is four a number that is not very high as compared to other departments.
Table 7: Technical
Technical personnel consist of IT officers and the rates of absenteeism are very low in this group of personnel. Through out the period is only one of the officers who are reported to be absent. This shows a high degree of commitment among the IT officers, also the group has the lowest number of absenteeism cases.
Findings
Table 8: combination of all departments

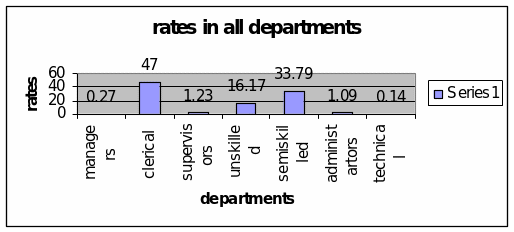
Based on the data analyzed it is clear that the clerical department has most of the people and total days for each one of them is 344 which represents the highest rate of absenteeism. It also shows that nearly every day there is a person in this department who does not report for work. The other department following the clerical department is the semi-skilled personnel that have a record of 247 days for the period of one year, whereas the unskilled personnel have higher rates of 120 days. From the table these three departments contribute a lot to the higher rates of absenteeism at the call center. Thorough investigations should be carried out in order to determine the reason as to why there are high rates of absenteeism.
Supervisors and administrators also have reported cases of absenteeism but the rates are minimal while technical personnel and the managers have the lowest rates. With the technical personnel having the lowest, It means that there is a certain reason that is contributing to high rates of absenteeism among certain groups while others having minimal rates. The groups with higher rates they are basically the low level personnel and the manger should ensure that investigations are carried out to determine the reason.
Table 9: shows relationship between service years and rate of absenteeism
Service years mean:

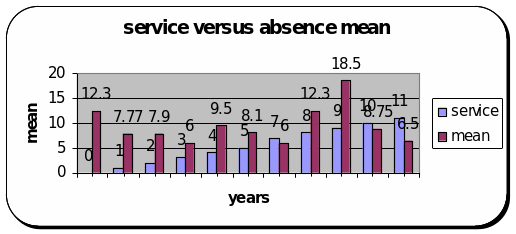
People who have less than one year of employment have the highest rates of absenteeism, on the other hand the ones with highest number of years in service have the minimal rate of absenteeism.
Recommendations and conclusion
The manager can set up a payment system whereby they will be paid based on performance, it will mean that the more one performs the more one earns. This would work out effectively in minimizing absence of the employees in the departments that are highly affected.
Since the departments registering high rates of absenteeism are very vital it means that the operations at the call center are highly distrusted by this. In order to improve the operations the rates of absenteeism should be minimized such that if a person has to be absent is for important maters and this would help to minimize absenteeism. Also it would encourage many of them to work and to attend job since they know that they will be paid based on what their performance.
In most cases when the low level personnel communicate their problem indirectly and this might be one of the ways used by the group. Also higher rates of absenteeism signify lack of satisfaction in work one is doing, the dissatisfaction may be because of various reasons that include poor working conditions and low salaries among others. Manager should carry out investigations based on these issues in order to establish the exact problem.
The manager should set up rules and regulations regarding absenteeism, this is because with strict rules it would be possible to minimize the rates since the employees fear subjection to the penalties of absenteeism. Apart from setting of strict rules the manager can implement certain incentives that would encourage the employees to attend to their duties effectively.