Introduction
The present report aims at assessing the financial health of Intel Inc. in 2013. The report analyzes trends in key indicators of financial performance, including total revenues, gross profit, net profit, total assets, and total equity. The report also provides an analysis of liquidity, leverage, and profitability using relevant financial ratios. The results of the analysis are used to identify the strengths and weaknesses of the company in terms of financial performance and provide recommendations for improving the current position.
Trend Analysis
The present section provides the analysis of key indicators of financial performance, including total sales, gross income, net income, total assets, and total equity. The values for these indicators for 2012 and 2013 are visualized in Figure 1 below for comparative analysis.
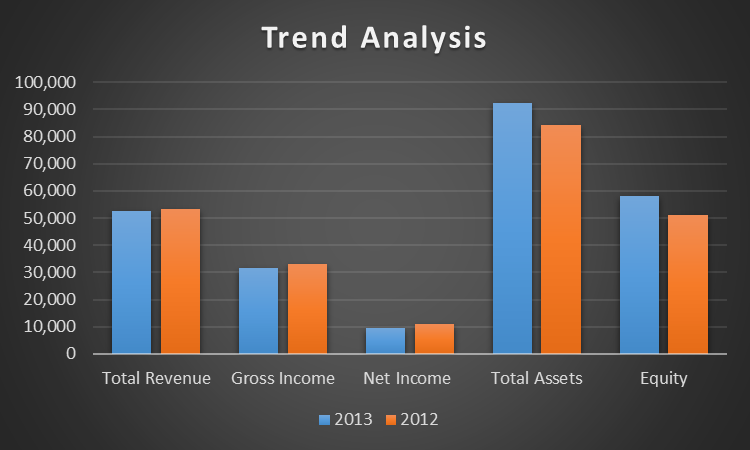
The analysis of the key indicator of financial performance provided controversial results. On the one hand, Intel was able to increase its total assets in 2013 by 9.49%. The major part of total assets growth was attributed to non-current assets (Intel, 2014). In particular, the company increased its total assets by purchasing property, plant, and equipment (PPE) and increasing marketable equity securities (Intel, 2014). It is also worth noticing that the growth of assets was financed by stockholder equity instead of debt, as equity grew by 13.77%. This implies the company was able to increase its assets without increasing its financial leverage, which is crucial for stable financial performance.
On the other hand, the company’s performance in terms of generating profits deteriorated in 2013 in comparison with the previous year. In particular, Intel experienced negative growth of -1.19% in total revenues. Additionally, both gross income and net income fell by 4.92% and 12.59% correspondingly, which may have negatively affected the profitability of the company. Considering that the total assets and total equity increased while the profits were falling, Intel experienced significant issues with returns on investments and efficiency (Schmidlin, 2014). This implies that the company’s management did not use the assets effectively to generate income. However, it should be acknowledged that the company may have had little time to use the assets to generate income. New assets may require additional investments to generate stable returns long-term. Such investments, however, should not affect total sales negatively.
In summary, the trend analysis demonstrated that the growth of total assets and total shareholder equity was a definite strength of Intel in 2013. At the same time, the decline in revenues, gross profit, and net income is the company’s weakness.
Financial Ratio Analysis
The present section provides an analysis of financial ratios to evaluate the performance of the company in terms of liquidity, profitability, and financial leverage. Calculated financial ratios with selected financial data are provided in Table 1 below. These measures of financial performance were selected as they all have a significant effect on the financial distress of firms (Susanti et al., 2020).
Table 1. Selected financial data and ratios.
Liquidity
Liquidity ratios demonstrate if a company has enough current assets to cover its current debt without attracting additional financing. In broad terms, liquidity is the amount of funds that should be available for investment (Rashid, 2018). These funds are usually available in the form of credit rather than in cash (Rashid, 2018). Liquidity is usually measured using two financial ratios, including current ratio and quick ratio (Rashid, 2018). A recent study based on a sample of UK firms demonstrated that liquidity plays a central role together with profitability when making a decision about investing in a company (Rashid, 2018). Thus, the importance of liquidity is difficult to underestimate.
The current ratio is calculated by dividing current assets by current liabilities. The quick ratio is calculated in a similar way; however, it does not take into consideration inventories, as they may be difficult to transform into cash. Thus, the quick ratio is calculated by dividing, subtracting inventories from the current assets, and dividing by the current liabilities. Any values above 1 demonstrate that the company has enough funds available short-term to cover the current portion of total debt. However, very high values of liquidity may demonstrate that the company has excessive funds that are not being invested effectively.
The results of liquidity analysis for 2013 and 2012 demonstrated that the company’s liquidity decreased inconsiderably according to the current ratio and remained unchanged according to the quick ratio. At the same time, Intel’s liquidity remained above 2, which demonstrates that the company had enough current assets to cover its current liabilities twice. Thus, liquidity is one of the company’s strengths.
Leverage
Financial leverage is the degree to which a company uses debt to finance its assets. According to Ahmed et al. (2018), leverage is one of the central factors that affect profitability. The central idea is that the higher the financial leverage, the higher the interest expenses, which implies that the company is forced to use the revenue for covering interest payments (Ahmed et al., 2018). However, a low level of financial leverage may mean that the company may be undermining its development opportunities by underutilizing debt.
Financial leverage is usually measured by debt-to-assets (D/A) and debt-to-equity (D/E) ratios. The higher the values, the higher the level of financial leverage. The analysis of the ratios demonstrated that Intel had low debt in comparison with equity in 2013 with 0.59 for the D/E ratio and 0.37 for the D/A ratio. Moreover, the level of financial leverage decreased in 2013 in comparison with 2012, as seen in Table 1. Thus, Intel’s leverage is another company’s strength, as it allows the company to borrow additional money for investment projects without significant harm to profitability.
Profitability
Profitability is one of the central measures used by stakeholders to make their decisions concerning investments in the company. In broad terms, profitability is the ability of a company to generate income effectively (Husain & Sunardi, 2020). Profitability is usually measured using gross profit margin and net profit margin. The gross profit margin demonstrates that how much funds are left after paying the direct cost of production.
In 2013, Intel’s Gross Profit Margin was 59.8%, which implies that the company uses 40% of the revenues to cover the direct cost of production. In comparison with 2012, the gross profit margin decreased by 2.3%, which implies that the cost of goods sold (COGS) increased. Net Profit Margin also decreased from 20.6% in 2012 to 18.3% in 2013, which is also a negative trend in terms of profitability. Thus, Intel’s profitability can be considered as the company’s weakness. However, a comparison with competitors may be needed to understand if the decrease in profitability is attributed to the changes in the market or to the changes in the company’s governance.
Summary and Conclusion
Strengths and Weaknesses
The analysis of Intel’s financial performance revealed several strengths of the company. First, the company demonstrated a significant growth of stockholder equity in 2013 which led to an increase in total assets. Second, the company’s level of financial leverage is low, which implies that the company can tolerate additional debt to finance future investments. Third, Intel has high liquidity, which implies that it has enough funds available short-term to cover the current portion of the debt.
At the same time, Intel has one major weakness that was identified as a result of trend and ratio analyses. In particular, the company demonstrated negative trends in terms of profitability growth, which may be a sign of concern. Since the profitability issues were accompanied by an increase in shareholder equity, the effectiveness of using assets and returns on investments should have also decreased.
Recommendations
The results of the analysis provided in the present report suggest future actions described below:
- The company should conduct a detailed analysis of its current efficiency in terms of COGS and other expenses to increase profitability.
- The company should search for attractive investment options, as it can finance new projects using debt due to the low level of financial leverage and high liquidity.
- The results of the present report should be tested by comparing Intel’s financial performance to its competitors to ensure the reliability of findings.
References
Ahmed, F., Awais, I., & Kashif, M. (2018). Financial leverage and firms’ performance: Empirical investigation of KSE-100 index. Etikonomi, 17(1), 45-56.
Husain, T., & Sunardi, N. (2020). Firm’s Value Prediction Based on Profitability Ratios and Dividend Policy. Finance & Economics Review, 2(2), 13-26.
Intel. (2014). Annual report 2013. Web.
Rashid, C. A. (2018). Efficiency of financial ratios analysis for evaluating companies’ liquidity. International Journal of Social Sciences & Educational Studies, 4(4), 110.
Schmidlin, N. (2014). The art of company valuation and financial statement analysis: A value investor’s guide with real-life case studies. Wiley.
Susanti, N., Latifa, I., & Sunarsi, D. (2020). The effects of profitability, leverage, and liquidity on financial distress on retail companies listed on Indonesian stock exchange. Jurnal Ilmiah Ilmu Administrasi Publik, 10(1), 45-52.