Introduction of Kenya
Kenya has become an investment target for many foreign countries and investors, with China at the forefront. The Kenyan demographics’ profile as of 2013 was primarily affected by factors such as increased mortality rates due to HIV/AIDS. As a result, the country generally experiences low life expectancy, deteriorated population growth rates, increased death rates, and continuous sex and age distributions (“Kenya,” 2020). About 40 percent of Kenya’s population accounts for 0-15.
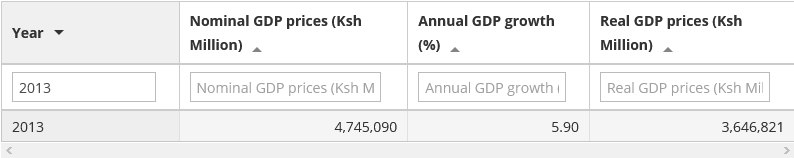
It is also notable that Kenya is still operating below the expected potential and standards. As such, Foreign Direct Investment (FDI) remains the solution to reviving the country’s economic status to facilitate equality in distributing its resources. Since 2013, China has been effortful in restructuring projects and improving infrastructure, especially the commonly known standard gauge railway (SGR). China has also ensured the provision of financial necessities to fuel Kenya’s development agendas. Kenya’s GDP for the year 2013 is as shown in the table below (“Annual GDP,” n.d.). The estimates for the figures for the year under analysis are based on the 2009 price estimates.
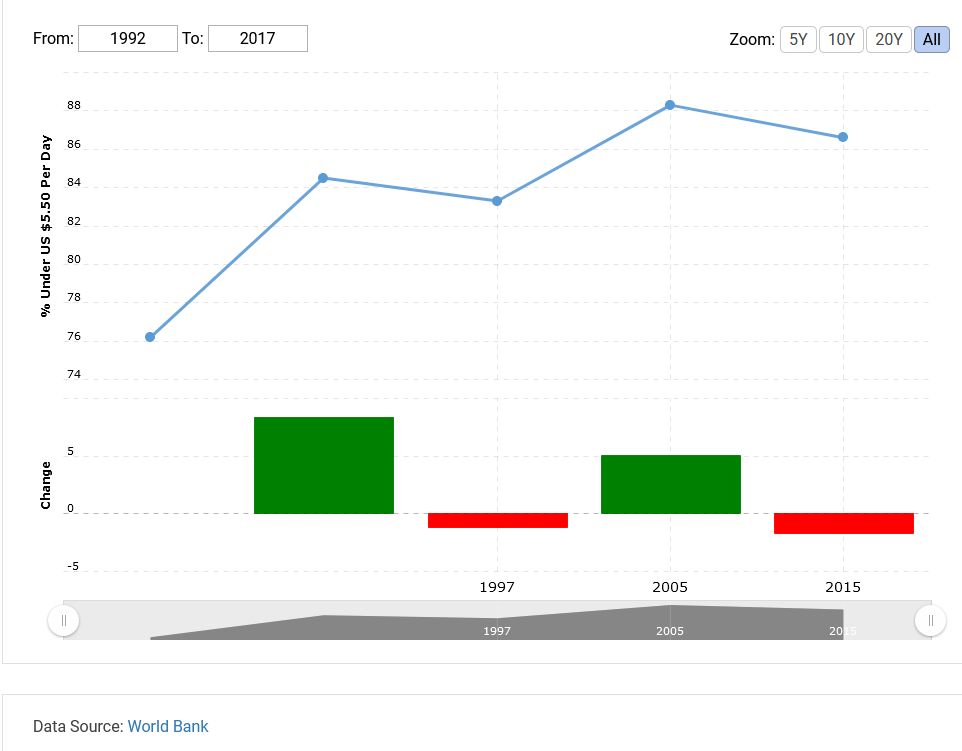
The poverty rate in Kenya has remarkably declined following the joint foreign initiatives that the country has engaged in since 2013. The graph below shows that the poverty rates have been increasing since 1992, with a slight decrease in 2013-2015.
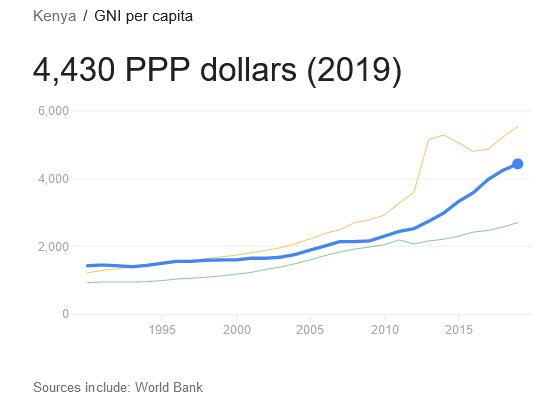
The human development index serves as a summarized presentation of the critical human development dimensions. The HDI value for Kenya in 2012 stands at 0.522, which is a notable improvement from the previous year’s 0.509 (“Understanding poverty,” 2021). Kenya’s services and agricultural sectors have outperformed others in the last decade and have caused significant economic improvements, especially in the infrastructure. The GNI/cap for Kenya from 1995 to 2015 has been increasing, as shown below.
Status of Inequality in Kenya
Kenya still struggles with robust inequality issues—the demarcation between the richest and the poorest remains on the increase in Kenya. Approximately less than 0.1 percent own excess wealth than the remaining 99.99 percent. In short, about 83000 individuals have acquired extreme wealth than the remaining 44 million people (Edward and Sumner, 2019). The wealthiest group earns incomes about 20 times higher than that of the poorest (Edward and Sumner, 2019). The country’s labor market has also been impacted by the series of informalities evident in the past few years. Using the Gini coefficient to understand the nature of distribution in Kenya, it is clear that the country’s inequality rates are significantly high, with resources distributed unfairly. In essence, the differential approach distributing the resources has caused the continued rural-urban gaps. Also, most development projects undertaken by China focuses on the urban areas rather than being universal, leading to widening of the rural-urban gaps.
The regional disparities and the increasing marginalization is caused by the fact that most of the country’s wealth (about 36%) is controlled by a small group considered the richest (about 10%) (“Measuring poverty,” 2020). The vast disparities between the existing regions have contributed significantly to the limited access to social factors such as education, leading to the shortage of skills required to undertake development activities. The poor control only 2 percent of Kenya’s wealth (“Understanding poverty,” 2021). Kenya has attained a strong relationship with foreign countries such as China and the U.S, leading to harmonized terms of trade. The two countries have adopted trade patterns that notably increase the chances for job creation. Despite the improvements, Kenya still suffers from a significant knowledge gap and deficiencies in pay premiums. The latter has been caused by the overdependence on the expatriates, especially from China. The structural changes that have occurred so far are driven by Chinese officials who assume that Kenya lacks enough expertise to undertake restructuring processes.
Different informalities such as gender, favoritism, and skills gap have affected the Kenyan labor market, leading to a broader skill premium index. The Chinese expatriates have set up several institutions to help manage the projects and create job opportunities for Kenyans to reduce poverty levels.
Presence of China in Kenya
China has treated Kenya as a gateway into the East African landscape and has used it as a strategy to robust economic investment platform. Even though the existing relationships between China and Kenya have been prejudiced for some political, economic, or social reasons and have been seen as a tactical approach used by China to invade the most creative sectors, Kenya has benefited significantly from the engagements (Bielikova & Paliderova, 2017). The infrastructure has significantly been impacted, and the virtual networks for broadening business possibilities developed. Also, such developments have been impactful in improving the quality of education due to better infrastructure, facilities, and personnel. It is, however, still arguable that the relationship between the two countries has partly eradicated and partly promoted poverty levels leading to continued inequality. When the funds are released to refurbish the various sectors, they get controlled by the wealthiest group.
The Belt and Road Initiative has had significant impacts on the Kenyan economy. The SGR will improve the transport sector because it links several places to the Port of Mombasa, a significant revenue source. Currently, the level of poverty has increased with the increase in severities associated with Covid-19 (Bigsten, Manda, Mwabu, & Wambugu, 2016). The graph below indicates the rates of poverty in Kenya before and after the outbreak of the pandemic. The latter has caused distractions in business, and the planned development agendas remained hanging.
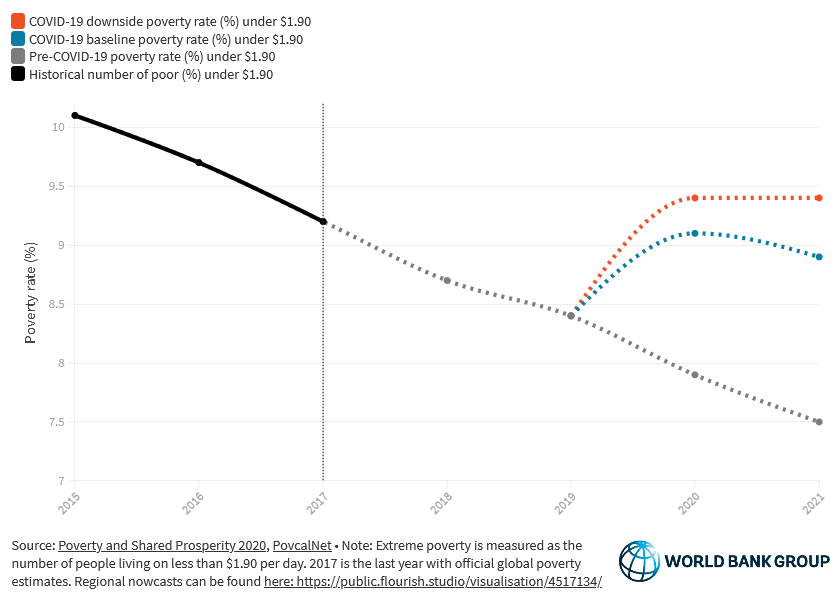
The World Bank Group highlights how poverty levels remain high in Kenya and other third-world countries due to the pandemic and uncalculated economic development plans.
References
Annual GDP. (n.d.). Web.
Bielikova, A., & Paliderova, M. (2017). Impact of foreign direct investments on the economy. New Trends and Issues Proceedings on Humanities and Social Sciences, 3(4), 235-240.
Bigsten, A., Manda, D. K., Mwabu, G., & Wambugu, A. (2016). Incomes, inequality, and poverty in Kenya. Growth and Poverty in Sub-Saharan Africa, 343-369.
Edward, P., & Sumner, A. (2019). The end of poverty: Inequality and growth in global perspective. Springer.
Kenya. (2020). Web.
Measuring poverty. (2020). Web.
Understanding poverty. (2021). Web.