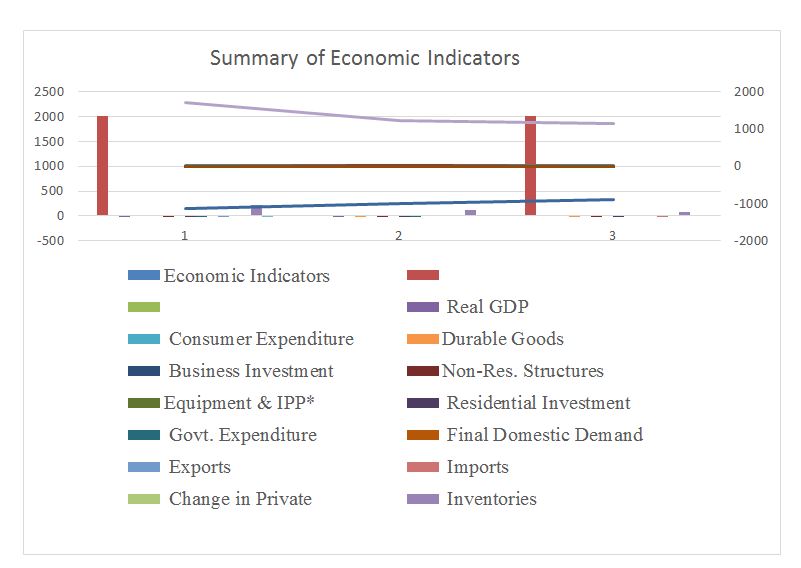
Summary of Excel Spreadsheet
Report Analysis and Forecast
Investors can use the economic review to determine whether the economy is experiencing a recession, for instance, before deciding whether to invest in a business that depends on purchaser spending. Economic indicators offer information about an economy and its growth or shrinking. Government departments and organizations each month notably issue most indicators. For evaluation purposes, they characteristically report on activity from earlier months and years. This essay examines the top 10 economic indicators stakeholders in the United States to give the country’s economic outlook between August and December 2022 and the forecasts for the first two quarters of 2023.
Gross Domestic Product
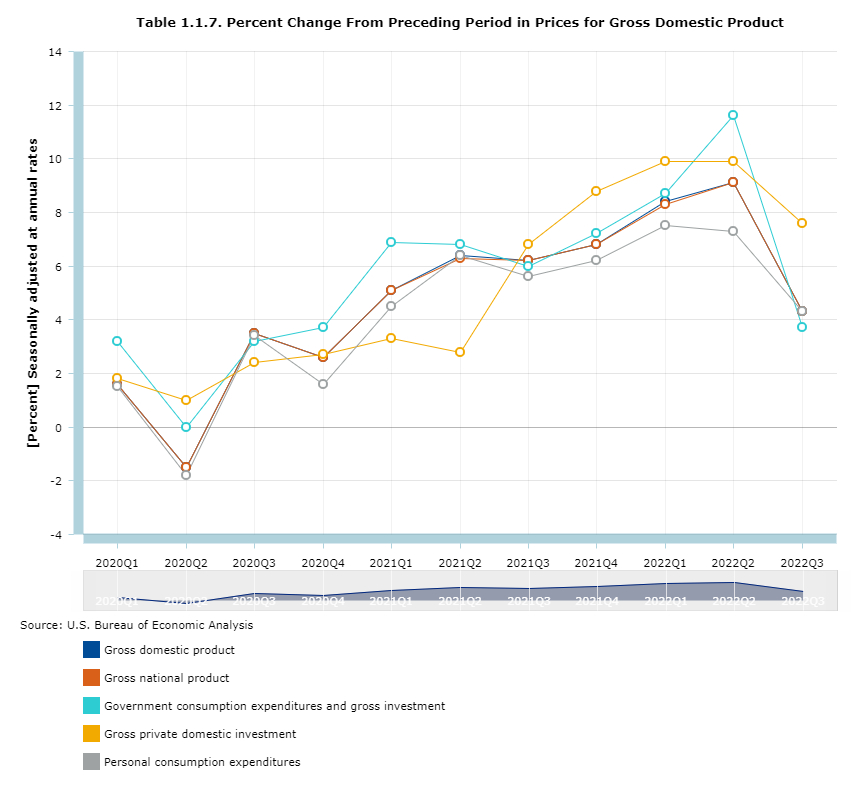
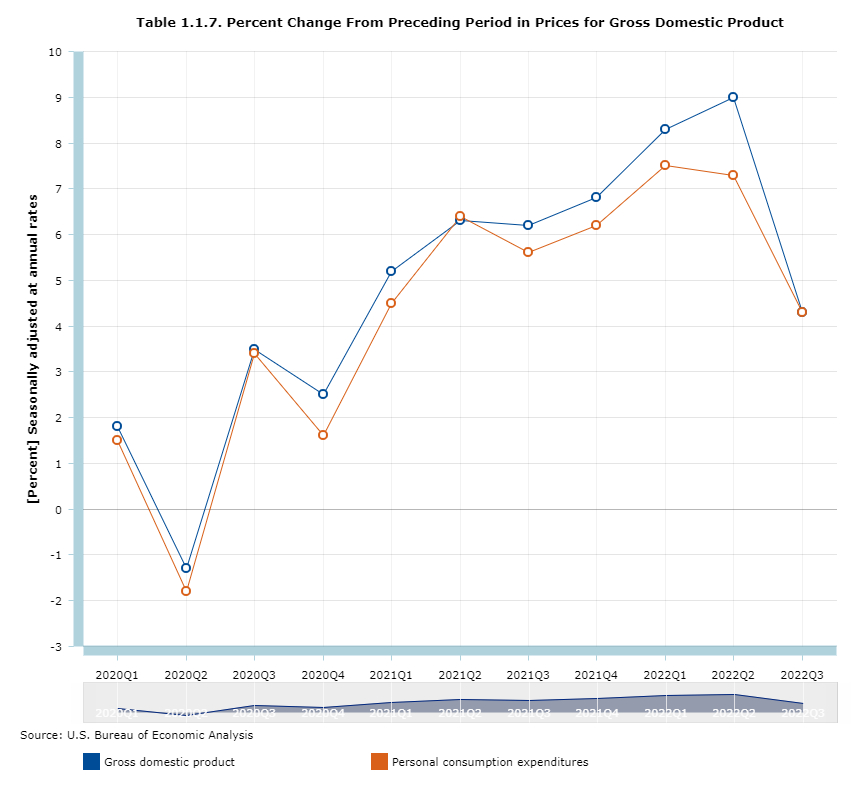
An economy’s gross domestic product, or GDP, offers an overview of the commodities and services produced and signifies whether the economy is expanding or contracting. When analyzing the quarterly change in GDP, the department of commerce breaks down the activity into changes in consumer spending, business investment, government spending, and the net impact of international trade. The changes in interest rates affect the overall economy by changing the demand for goods and services purchased on credit. Higher interest rates reduce the interest on sensitive spending, and lower interest rates increase interest on sensitive spending (Amiti et al.,2019). Therefore, when the interest rates are high, there would be increased foreign capital inflows as the major U.S. assets become more attractive than the foreign-purchased assets, causing an increase in dollar values.
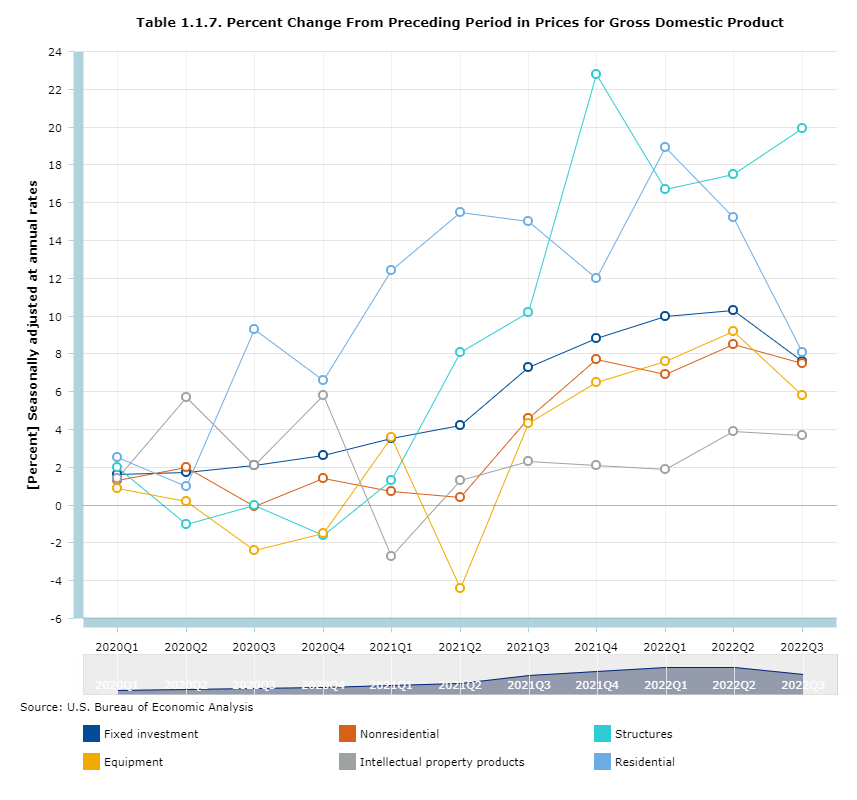
As the dollar value rises, the import prices decline against the imported commodities, and the exports become expensive compared to the foreign goods. Besides, when there is a fall in interest rates, the import and export factors are reversed, and there is an increase in net exports. As a result of implementing the monetary measures, there is a projected increase in GDP in the next two quarters of 2023, specifically on the investment level, consumer spending, and net exports from various components of the economy.
Industrial Production
The output of manufacturing-based industries, including those that produce commodities for consumers and businesses, is measured as industrial production. Mining, manufacturing, and utilities are all part of the industrial sector. Despite their modest GDP contributions, these industries are susceptible to changes in interest rates and consumer demand. An essential tool for predicting forthcoming GDP and significant economic realization is industrial production. Since high industrial production levels can result in unchecked consumption and quick inflation, central banks also use their numbers to measure inflation (Andler & Kovenr, 2022). The producers would tend to increase the prices of final products to compensate for the increased wages caused by hiring more workers, which, in turn, increases production costs. As a result, there is a likelihood of inflation in the next two quarters of 2023 due to the manufacturers’ increased prices of final goods and services in the economy.
Employment Rate
The number of new jobs created in the preceding month by the private, public, and specific industries and the unemployment rates isis included in the department of labor’s report on employment. Employment patterns showed growth in most districts, with two districts reporting flat headcounts and a weakening overall labor demand. Hiring and retention difficulties further relaxed from August to December 2022, even as labor markets remained tight and flat (Ball et al.,2022). Wages moderately increased on average, while a few districts showed some relaxation on wage pressures. The forecast outlook pointed at stable or slowing employment growth, and at least further wage growth moving into the future.
When the GDP increases in the short run, there is an increased employment rate as more employees are hired to meet the demand for basic commodities. However, monetary policies might not raise the GDP growth rate permanently since an economy’s GDP, in the long run, is determined by a country’s production capacity (Andler & Kovenr, 2022). Some determinants of long-run GDP include labor force size, amount of capital stocks in eth economy, and technological advancement.
Consumer Spending
Consumer expenditure refers to the total amount of cash people and households use on final commodities and amenities for their use and enjoyment. Modern consumer expenditure metrics include all private acquisitions of durable and non-durable services and products. Consumer spending is a crucial complement to individual saving, investment outlay, and economic development. Consumer expenditure data is available in the department of commerce’s monthly release on individual income and outlays.
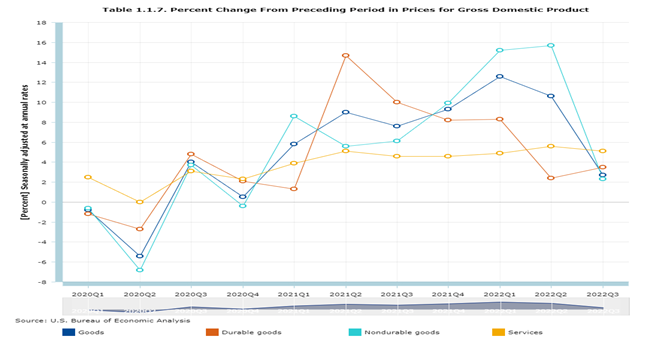
Growth of real consumer outlays remained positive over the last quarter of 2022 owing to continued expenditure on services, while expenditure on durable goods fell in the period. Consumer prices rose moderately, with most districts showing strength. The growth pace slowed on average over the period, with a mixture of improvements in supply chains and a slowing demand (Domash & Summers, 2022). Retail prices declined as consumers sought discounts. Prices fell for a few commodities, such as steel and lumber, even as food prices increased further in most districts. Housing rent moderated in some districts, and homes slightly fell with the weak demand. Inflation is expected to remain steady or reduce moving into the future.
Inflation
Inflation is a rise in the average price of products and services across an economy. High inflation may signify that the economy is not doing well, whereas very low inflation may signal a downturn. Many Districts have had periods of unpredictability due to inflation, and it may be challenging to restore the economy under such circumstances, resulting in great poverty among the population. Consumer price index (CPI) and Wholesale Price Index (WPI) are the most often used inflation indices. Inflation is gauged using the producer price index as it affects producers.
When there is an increased production cost due to a lack of proportional decrease in aggregate demand, there is a likelihood of costs-push inflation. Generally, when there is an increase in the cost of factors of production, there would be an increased production cost (Ball, Leigh, & Mishra, 2022). Assuming that the manufacturer’s productivity levels reach the maximum, they will not maintain the existing margin of profits. Therefore, if manufacturers cannot accept the lowered profits, they will increase the prices of basic commodities.
Home Sales
For many people, buying a home is a major investment. As a result, the monthly data on new residential sales from the department of commerce reflects consumer altitude. Based on contracts to buy new and existing homes, this report substantially impacts regional and national sales of single-family homes. Higher Interest rates reduced home sales at a moderate pace. Overall, some Districts saw a steep fall with apartment leasing slowing. Residential constructions modestly slid on average, whereas non-residential constructions showed mixed signals but dropped slightly on average (Francis, 2022). Commercial leasing, however, slowed slightly as office vacancies increased. Bank lending slid further modestly with weak demand and tightening credit standards. Agricultural conditions remained flat or slightly up as the energy sector activity increased slightly on average.
Construction Spending
Spending by consumers and businesses often increases when the GDP is rising significantly. Spending on construction also tends to rise during economic expansion. However, construction spending often declines as the economy contracts. The department of commerce report includes a split of residential and non-residential public and private construction (Domash & Summers, 2022). The supply of basic commodities became affected, extending further to 2022. In addition, the U.S. government implemented economic policies to reduce inflation in the short term but later contributed to the increased inflation growth in the entire economy (Andler & Kovenr, 2022). Due to the monetary and fiscal policies implemented, the American government and its federal reserves have continued implementing measures to reduce future inflation.
Manufacturing Demand
The manufacturing sector entails the transformation of basic materials such as ore, wood, and food into finished products like metal items, furniture, and processed foods. Converting raw materials into something else more useful adds value. The shipment, inventory, and order reports from manufacturers provide a clue as to how much demand there is for manufactured goods (Cascaldi-Garcia, 2022). The manufacturing sector declined, with the new orders index remaining negative. The shipment index remained positive, although at low levels, as firms worked through backlogs. The semiconductor industry registered strong demand as furniture manufacturing showed a slow reduction. Delivery times and inventories fell further over the period. Firms’ expectations are expected to drop with new orders and future activity indexes trending lower and negative. A few firms are expected to experience a surge in employment and capital spending over the next two quarters of 2023.
Retail Sales
Retail sales serve as a crucial economic barometer and show whether there is real inflationary pressure. Retail sales, which chart the cumulative purchases of durable and perishable commodities, are a key gauge of purchaser demand for finished products. Consumer spending health is shown by the department of commerce’s monthly release on retail and food service sales (Bivens, 2022). Non-auto retailers spending and restaurateurs experienced slight declines in sales with lower traffic, lower spending per customer, and a need for discounts. Low- and middle-income consumers spend less and opt for lower-priced goods and services. Auto dealers saw a slight sales increase with increased inventories (Roth et al.,2022). The sector registered a slight improvement from the poor conditions in the previous quarter. Small to medium-sized banks experienced slowed demand across all segments and drop-in refinancing activity. In addition, it has been prospected that the trend will continue in the first two phases of 2023.
Home Building
The number of houses that builders have started construction on and the number of permits that have been considerably obtained to start setting up dwellings symbolize the real estate developer’s confidence level in the economy. It also stimulates local economic activity, including employment and substantial income for new inhabitants and construction employees (Roth et al., 2022). When the number of construction projects increases, the economy does significantly because many people can afford to run such costly projects. Retail and restaurant figures showed mixed signals over the period. Online retailers experienced reduced sales from last quarter. Many Districts have had periods of unpredictability due to inflation, which may be challenging to tourism, affecting retail and Restaurant businesses under such circumstances, resulting in reduced economic activity. Different inflation values are considerably premeditated and traced as indices depending on the chosen products and services used.

Summary Forecast
The economic activity was flat and slightly up since August 2022, down from the modest average growth pace in the earlier months. Five U.S. Districts reported slight and modest gains in activity, with the rest reporting either no change or a slight decline in their activity. Interest rates and inflation reduced the activity as many reports showed greater uncertainty or increased pessimism about the economic outlook. Non-auto consumer spending showed mixed signals but remained averagely on balance with slight gains (Amiti et al.,2019). Low to middle-income consumers were pushed by inflation to resort to lower-priced goods. Travel and Tourism reported moderate gains in activity, with restaurants and high-end hospitality experiencing increased demand. Auto sales experienced a slight average decline; however, sales slightly surged in a few districts because of higher inventories. Manufacturing activity showed mixed signals across districts but with a slight, on average, increase. The demand for nonfinancial services remained flat, with some districts seeing softening.
Conclusion
The economic activity pace has been uneven in the last quarter of 2022, with slight variations per economic indicator. The overall economic activity remained steady and generally unchanged after an annual decline rate of 1.6% and 0.6% in the first and second quarters of 2022, respectively. The GDP increased slightly in the last quarter, owing to the large contribution from real export. The first and second quarters of 2023 are expected to register slight economic growth, as witnessed in the last two quarters of 2022. In addition, implementing monetary and fiscal policies by the federal reserve has aimed at stabilizing the economy by reducing the interest rate, increasing government spending and increasing the revenue distribution to the public. There is an expected potential economic growth by the end of 2023 after a series of poor economic performances.
References
Amiti, M., Heise, S., & Kwicklis, N. (2019). The impact of import tariffs on U.S. domestic prices. Federal Reserve Bank of New York. Web.
Andler, M., & Kovenr, A. (2022). Do corporate profits increase when inflation increases? Federal Reserve Bank of New York. Web.
Ball, L., Leigh, D., & Mishra, P. (2022). Understanding U.S. inflation during the COVID era. Brookings Institution. Web.
Bivens, J. (2022). Corporate profits have contributed disproportionately to inflation. How should policymakers respond? Economic Policy Institute. Web.
Cascaldi-Garcia, D. (2022). Forecast revisions as instruments for news shocks. International Finance Discussion Paper, (1341). Web.
Domash, A., & Summers, L. H. (2022). A labor market view on the risks of a U.S. hard landing (No. w29910). National Bureau of Economic Research.
Francis, R. D. (2022). Movin’On Up? The Role of Growing Up Rural in Shaping Why Working-Class Men Do—and do not—Seek to Improve Their Labor-Market Prospects. RSF: The Russell Sage Foundation Journal of the Social Sciences, 8(4), 68-86.
Roth, C., Settele, S., & Wohlfart, J. (2022). Risk exposure and acquisition of macroeconomic information. American Economic Review: Insights, 4(1), 34-53.