Introduction
This report provides information regarding the Resource Scheduling project. The Resource Scheduling project is useful for a consultant company that provides resources of different types to various companies for a particular duration. An example of a company that would require this kind of software is an IT consultant company. Such a company has developers, testers, project managers, technical architects, business analysts, etc. with different levels of experience and different expertise. Another example is a company providing technicians to get work done (servicing, repairing, etc.) on an hourly basis.
The company requires keeping a tab on the available resources. The resources also need to be classified into resource types so that they can be easily identified when a client requests for resources of a particular type. The company also needs to keep records of client details as well as resource requests they have made. A resource request typically consists of resource type and the duration when they would be required to work for that client. A client request may be confirmed or not an also there is a possibility of unavailability of the particular resource type. Both these possibilities need to be incorporated in the project. Finally, the reports in the form of schedules for each of the resource as well as based on the resource type need to be made available in order to check who has to work where and when.
The structure of the document is based on the activities required to be completed. The report starts with the user requirements that are provided in detail along with formal specification of part of the system so as to get familiar with the project. A data flow diagram along with database design provides further insight into the project from a technical perspective. A prototype design, test specification and quality plan including quality assurance processes are also outlined. A project plan and schedule setting out milestones, resource usage and estimated costs in Singapore Dollars are also provided to complete the report. The report ends with a conclusion that summarizes the report.
User requirements
- Resources are classified based on resource types.
- Resource information needs to be stored which includes name, resource type and any comments on the resource, if required.
- Customer information needs to be stored which includes the company address and contact details as well as the contact details of the point of contact in that company.
- Customer requests for resources are made by scheduling a resource for a particular day for particular time based on resource type.
- If resources are available, the user can allocate and confirm the resources for that particular client.
- Schedules for resources are prepared based on resource types as well as resources.
- If resources are not available, alternate suggestions regarding schedule is provided based on the schedule of the resources obtained.
Architecture
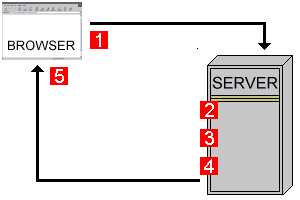
The architecture used for the project is client-server architecture. This architecture applies irrespective of the language chosen for executing the server-side processes. In this case, a web browser acts as the client and a specific server machine is assigned where the program resides. A user, for example, seeks to view the resource schedule for the coming week. This sends a request from the browser to the server (step 1 in figure).
The server then checks the headers and uses this information obtained to locate the necessary program (step 2 in figure). The data from the headers (in this case, it is the period during which the resource schedule is to be provided) is passed to the program (step 3 in figure). The program then processes this data and the resulting schedule is returned to the server (step 4 in figure). The server then sends the resulting schedule formatted in HTML to the browser which displays the HTML page (Step 5 in figure). Thus, a dynamic HTML page is generated using this client-server architecture. (www.webdevelopersnotes.com, 2000)
Partial formal specification
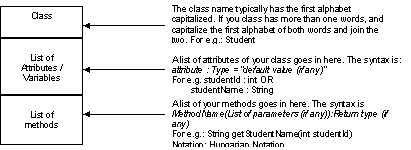
The formal specification is provided using Unified Modeling Language (UML). “A Class diagram gives an overview of a system by showing its classes and the relationships among them. Class diagrams are static — they display what interacts but not what happens when they do interact” (Miller, n.d.).
The notation used in a class diagram is shown below:
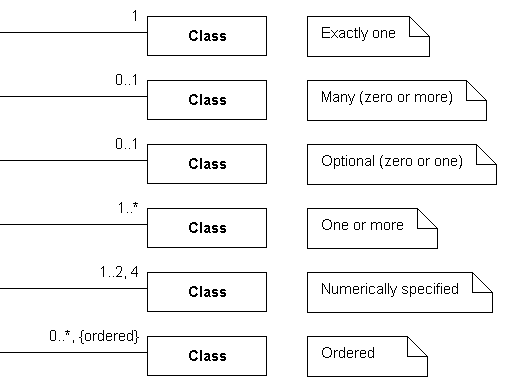
The relationship between classes is shown with the help of lines and one of the notations below to depict the relationship.
A class diagram is used to represent the project as seen in the figure below.
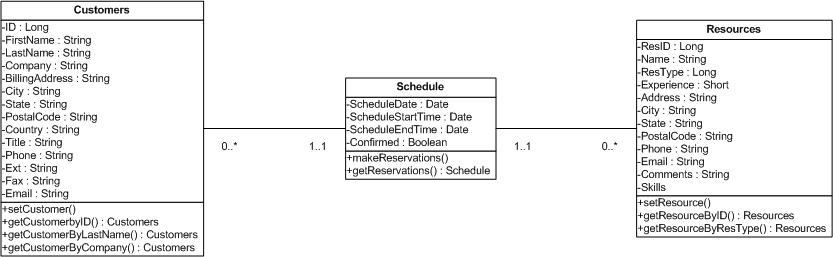
There are three main classes – Customers, Resources, and Schedule.
A customer can request for many resource types and each resource type can be requested multiple times. Also, a resource can be scheduled for a customer multiple times. Thus, a customer and resource have a many-to-many relationship. This many-to-many relationship is depicted using another class Schedule that connect the two classes with a one-to-many relationship.
A customer may have not requested for a resource yet and also a resource may have not been scheduled yet. However, a resource schedule is associated with one and only one resource and one and only one customer. Thus, a Customer class has a zero-to-many relationship with Schedule class and a Schedule class has a one to one relationship with Customer class. Similarly, a Resource class has a zero-to-many relationship with Schedule class and a Schedule class has a one to one relationship with Resource class.
Data flow design
The notations used to create data-flow diagrams (DFDs) are known as Gane and Sarson notations (Ambler, c. 2003).
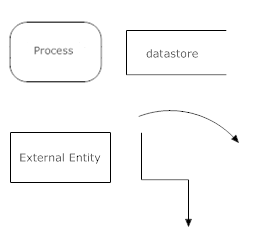
The four notations used are explained in brief below:
- A square represents an external entity that is either a source or a destination of data, for example, customers and resources in this case.
- A rounded rectangle represents a process that takes data as input, processes it and provides an output, for example, request resources, make reservations, etc.
- Arrows represent the flow of data between the other notations.
- An open-ended rectangle represents a data store such as the database in this case.
The data flow diagram for the project is shown in the figure below.
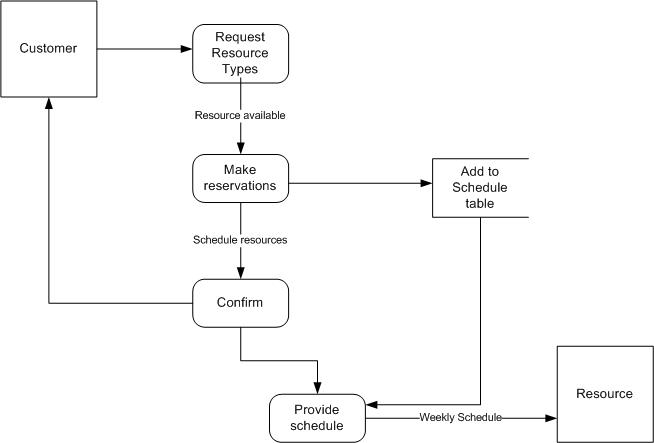
A customer requests for particular resource types. If resources are available during the period required, reservations are made and the schedule details are stored in the database. Once the resources are scheduled, customer is given a confirmation and a resource schedule is appropriately provided to the resources.
Database design / Data dictionary
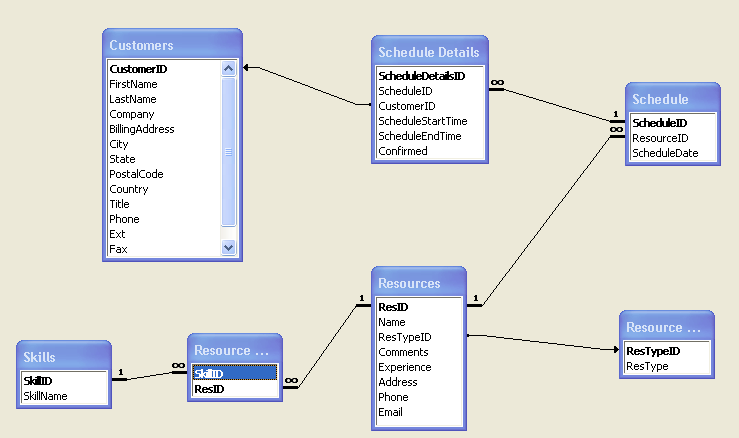
The database consists of seven tables. The description of each table is provided below:
- Table Customers – This table contains the details of the customer including the company details, address, contact person and his contact details. This is a master table.
- Table Resources – This table contains all the details regarding the resource including experience and contact details. This is also a master table.
- Table Resource Types – This table contains all the possible resource types.
- Table Skills – This table contains all the possible skills applicable (e.g. programming skills such as C#, ASP.NET, MS SQL, etc.).
- Table Resource Skills – This table connects a resource with all of the skills s/he knows.
- Table Schedule – This table contains the schedule date for a particular resource.
- Table Schedule Details – If the resources are scheduled based on hourly slots, then this table helps note down the start time and date and also whether the reservation is confirmed or not.
The ERD diagram of the database is as shown below:
The data dictionary of the project is provided in detail below for each of the seven tables in the project.
Table 1: Data Dictionary.
Prototype design
The prototype design of three forms is shown below. The forms are simple data entry forms consisting of text boxes and drop down menus for entering data.
Customer Data Entry Form
Figure 8: Customer Data Entry Form.
Resources Data Entry Form
Figure 9: Resources Data Entry Form.
Resource Type Data Entry Form
Figure 10: Resource Type Data Entry Form.
Test specification
The testing process for Resource Scheduling will be based on the following goals:
- Thorough testing for coding bugs and logical errors
- High quality: well-executed software, easy to use interface, reasonable performance
- Errors are handled appropriately ensuring that the program does not end abruptly.
The system will be tested on machines with the following configuration:
- Windows XP and Windows Vista
- 1.7+ GHz
- 512 MB RAM
- Browsers
- Internet Explorer 6.0 and 7.0
- Firefox 2.0
Components to be tested:
- Interfaces
- Resources Data Entry Form
- Resource Types Master Form
- Skills Master Form
- Customers Data Entry Form
- Reservations Data Entry Form
- Resource Schedule Report
- Resources By Type Report
- Help components
- Help Files
- Tutorials
- Server Installation
The types of testing that will be conducted on the project are:
- Unit Testing: A white box testing will be conducted using Basis Path testing methods.
- Integration Testing: An integration testing will be carried out on completion of the coding using black box testing.
- Validation Testing: All input controls such as textboxes, drop down menus, etc. will be validated as per the constraints (type, size, etc.) levied on it based on data dictionary.
- User Acceptance Testing: Users will formally test the software based on the processes they follow when scheduling resources manually and report any issues.
No special resource will be used for testing. Except for user acceptance testing which will be carried out by the users, the remaining tests will be conducted by the development team headed by the project manager.
A bug log and a test log will be maintained in Microsoft Excel.
Project plan
The project schedule was prepared using Microsoft Project. A WBS was created up to three levels. Each entry in WBS has been assigned a number depending upon the level it is for ease in identification. Expert judgment was used in order to arrive at durations for each task. The dependencies of each task were noted down. Once the starting date of the project was provided, Microsoft Project automatically provided the start and finish dates of all the tasks based on the duration and predecessors provided.
Table 2: Project Schedule.
The Gantt chart of the project is as shown below:
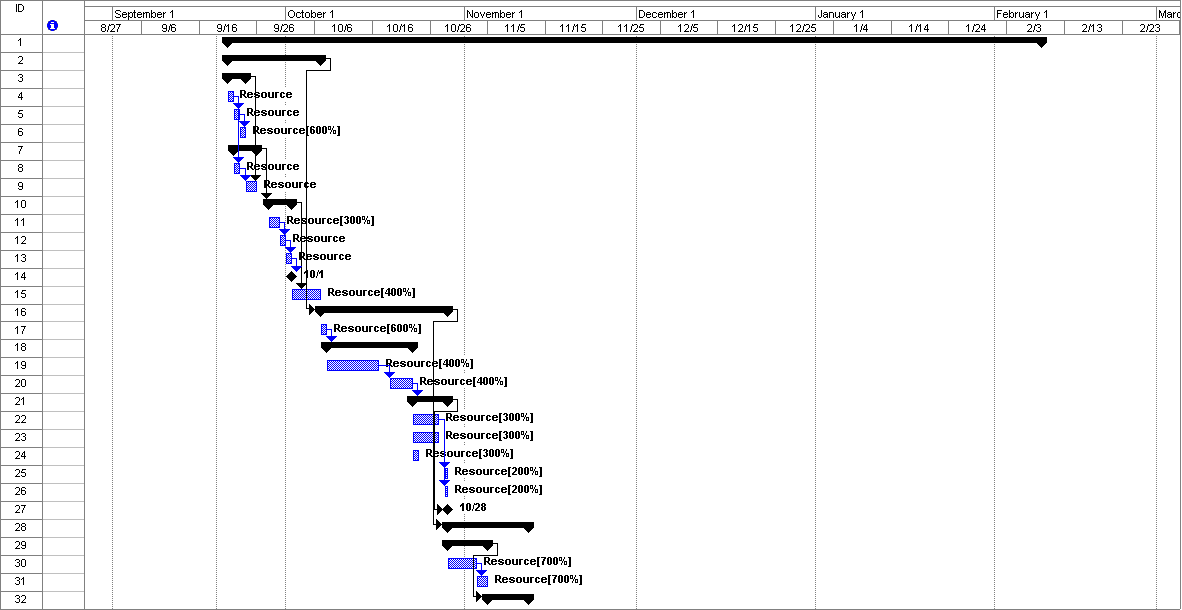
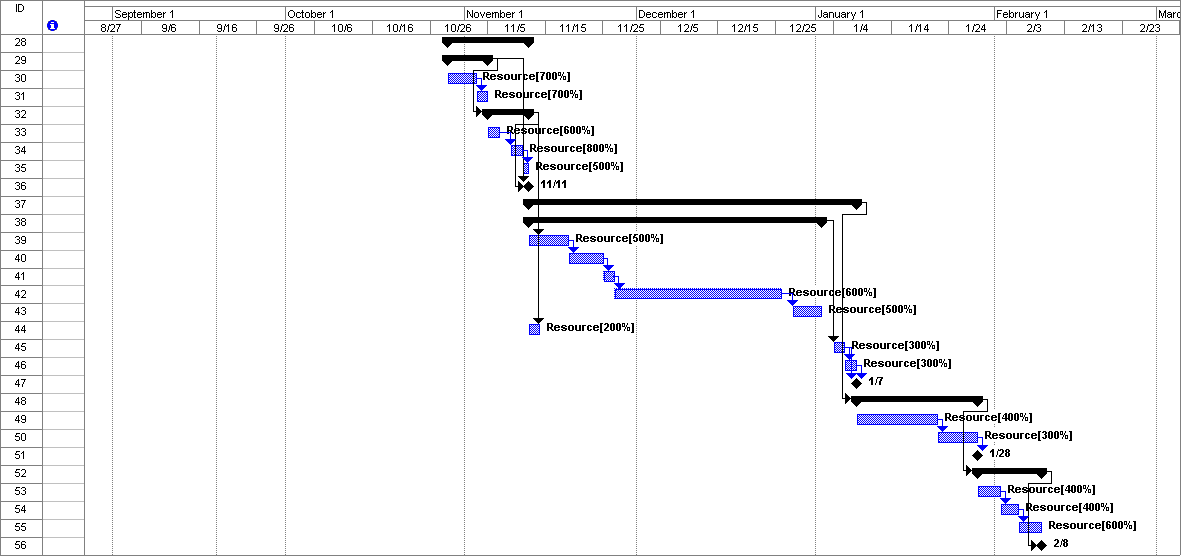
In order to calculate the cost of the project, each task was assigned a resource. The resource units were allocated instead of any particular resource. Also, an average cost of 30 SGD per hour was assumed for each resource. Once the resources were allocated, Microsoft Project again provided the costs based on the resource units required and the cost per hour of the resource.
Table 3: Cost per task and overall cost.
The total cost based on this comes to 107, 520.00 SGD.
The milestones of the project are:
Quality plan
Quality assurance process consists of several umbrella activities that assist in continuous improvement of processes in an organization (Dinsmore et al, 2006). Quality assurance activities can help ensure that quality is built into the project, instead of being tested or checked at the end of the project. Continuous improvement in processes help eliminate activities that provide no value addition to the process and also helps introduce new activities that add value to the processes or modify existing activities so that it can provide better value, thereby allowing operating the organization processes at very high levels of efficiency (Dinsmore et al, 2006). Quality assurance endeavors to ensure that the scope, cost and time goals of a project are met satisfactorily (Kerzner, 2003).
The most commonly used technique for quality assurance is a quality audit. Harold Kerner (2003) defines quality audit as “an independent evaluation performed by qualified personnel that ensures that the project is conforming to the project’s quality requirements and is following the established quality procedures and policies”. It is important to note here that project team members should not be used for audits as Kenneth Rose (2005) warns that “project team members may be just too close to things to get an accurate picture”.
With the help of a quality audit, an organization can ensure that there is compliance with the policies, processes and procedures as defined in the project plan for the project and any deviations from them are noted down. The result of a quality audit comes in the form of corrective and preventive actions, defects, and change requests. Also, a quality audit is used to confirm whether these change requests, corrective and preventive actions and defect repairs that were identified in earlier audits or using other methods have been corrected or correctly implemented.
A quality audit usually requires a root cause analysis to be conducted post the audit. This involves examining the problem(s) found, especially ones that have been a repeat problem or has a high impact and discovering and tackling the underlying issues to avoid reappearance of the problem.
This project demands high quality and in order to achieve that frequent quality audits will be conducted. The frequency of quality audits would ideally take place every month; however, if many non-compliances are found in any audit, then the management can take a call to have a quality audit every two weeks instead of a month. The report of the quality audit should be a formal report and needs to be submitted to the management. All corrective and preventive actions will be noted along with action items and start date. Defect repairs will be added to common project bug log. Any process improvement suggested and implemented will be thoroughly documented and their effectiveness will be measured.
Reviews, walkthroughs and inspections will also be conducted in order to evaluate the system.
Peer review and expert review are the two main types of reviews that will be conducted in this project. Expert review, as the name suggests, is conducted by an expert in that field while peer review is conducted by fellow colleagues. When the accuracy of the content is important and needs to be checked and corrected as required, an expert review is used. On the other hand, a peer review is used when it is required to check the structure rather than the content although content could also be checked. All deliverables will be first peer reviewed to ensure that the structure is appropriate and the applicable standards are followed for the same. An expert review will then be conducted to ensure that the content is correct.
A walkthrough is time-consuming and requires “walking through” the code and checking for content and structure. The walkthrough will be conducted twice during the implementation by the project manager. The final check will be a formal inspection of all documentation prepared for the project and would ideally be done by an external project reviewer or auditor.
Conclusion
The Resource Scheduling project is designed for a consultant company that provides different types of resources to companies on a need basis. The resources can be provided on an hourly basis. The user requirements for the project are provided in detail. The basic user flow is that a customer requests for particular resource types. If the resources under that resource type are available, then they are scheduled and upon confirmation, a periodic schedule is provided to the resource.
An outline architectural design, a class diagram, a data flow diagram, entity relationship diagram (ERD), database design, and a data dictionary are provided in order to understand the needs of the project and to discover any errors in the understanding.
A prototype design consisting of 3 screenshots of the forms used in the project are also provided to give an idea of how the project would work. A project plan outlining the schedule, milestones, resource usage, estimated costs in Singapore Dollars are also provided along with a Gantt chart. A test specification is outlined that provides the testing to be carried out, the test environment, the scope of the testing, etc. Finally, a quality plan provides information on the quality assurance procedures and also how the system will be evaluated. The project has been set up with all technical and project management activities taken care of as appropriate in order to ensure the success of the project.
Bibliography/Reference List
Ambler, S. W. (c. 2003) Data Flow Diagrams (DFDs). Web.
Dinsmore, P. C. & Cabanis-Brewin, J. (2006). “Chapter 11 – Project Quality Management in Practice”. The AMA Handbook of Project Management, Second Edition. AMACOM.
Kerzner, H. (2003). “Chapter 20 – Quality Management”. Project Management: A Systems Approach to Planning, Scheduling, and Controlling, Eighth Edition. John Wiley & Sons.
Miller, R. (n.d.). “Practical UML™: A Hands-On Introduction for Developers”. Web.
Prasad, N. & Lord G. (2006). “Protein Express Project Quality Management Plan”. Web.
Rose, K. H. (2005). “Chapter 4 – Project Quality Planning”. Project Quality Management: Why, What and How. J. Ross Publishing.
Rose, K. H. (2005). “Chapter 5 – Project Quality Assurance”. Project Quality Management: Why, What and How. J. Ross Publishing.
Rose, K. H. (2005). “Chapter 6 – Project Quality Control and Quality Improvement”. Project Quality Management: Why, What and How. J. Ross Publishing.
Turbit, N. (2005). “Project Quality Planning“. Web.
webdevelopersnotes. (2000) “The Client Server Architecture”. Web.