Introduction
Data Flow Diagram (DFD) is used to describe the flow of activities from one center to another one. A data flow diagram can be defined as a diagrammatic procedure that represents external entities, logical storage, and where data flows in a system. DFD is instrumental in operational systems where a function may be of great significance and more complex compared to how the system can be manipulated. DFD was first applied in the software engineering sector as a notation for studying system design issues (Rajaraman, 2004). DFD makes it easier to track down information flow from one center to another one thus making it easier the identification of errors in a system.
Principles of DFD
A system can be broken down into subsystems and the subsystems can be further broken down into lower-level subsystems.
- Every subsystem is representative of activities that involve the processing of data.
- A process at its lowest level cannot be broken down.
- All processes have the features of a system, with an input and an output.
- Data flow from the outside (environment) into the system. From this process, data is produced as an output from the system.
Components of DFD
DFD system has several components. These components are:
A Process
This is the first component of DFD and can also be referred to as bubble, function, or transformation and it describes the system that converts input into output. A process graphically is represented in form of a circle but other system analysts may prefer representing it as an oval or a rectangle. A process name explains what that process does. An example of a process is shown below.

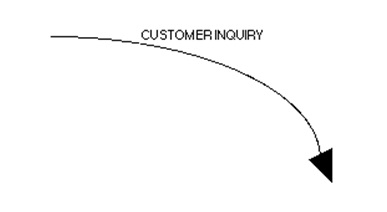
A Flow
An arrow is used to show the direction of movement of data; the movement of data is called a flow. A flow explains the flow of information or data in motion and a store describes data at rest. A flow represents data, character, or message. An example of a flow is shown below.
A Store
This shows data at rest. A store is represented by two lines. The name connoting a store is representative of all that flows in and out of it. The following is an example of a graphical representation of a store.

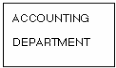
Terminator
A terminator is represented by a rectangle. It explains external entities that a system communicates and maybe a person or group of persons. A terminator can also be another system. A graphical illustration of a terminator is shown below.
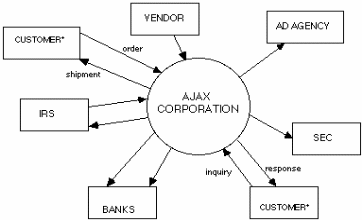
A perfect example of a data flow diagram is shown below.
Types of Data Flow Diagrams
Data flow diagrams can be classified as either logical or physical. A logical DFD focuses on a business and how it operates; it explains business events and the data required to produce such an event. On the other hand, physical DFD describes how a system can be implemented.
Data Flow Diagram Approaches
There are two approaches to the Data flow diagram. These are:
- Top-Down Approach: this begins by drawing a context level diagram that can be decomposed into sets of processes, data stores and data flows.
- Event Partitioning Approach: this is operating differently from the above approach. In this approach, lower-level subsystems are identified and then used to build up a system (Shelly, Cashman & Rosenblatt, 2001).
References
Rajaraman, A. (2004). Analysis and design of information systems. New York, NY: PHI Learning Pvt. Ltd.
Shelly, B.G., Cashman, J. T., & Rosenblatt, J, H. (2001). Systems Analysis and Design, 8th Ed. New York, NY: Cengage Learning.