Introduction
Inefficiency in centralised process of generating energy has led to innovative ways of monitoring efficiency. Of great importance has been the introduction of load duration curve (LDC). This paper will examine load duration curve.
The notion of a load duration curve
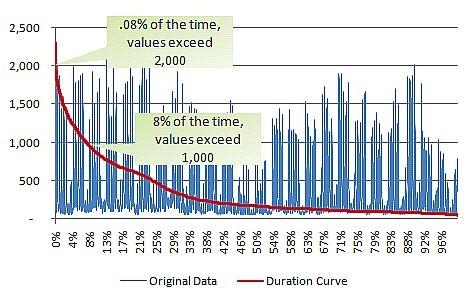
LDC provides information on the amount of power utilised during a given period. LDC is usually represented in a graph between the load on power plants and the produced energy in kilowatts. Area under the curve in LDC provides an indication of the amount of energy demanded. Furthermore, loads in LDC are usually arranged in sliding order of their magnitude. LDC chart is essential since it provides a view on the efficiency of energy grid. The figure below shows an example of a LDC.
How the shape of the LDC affects technology mix
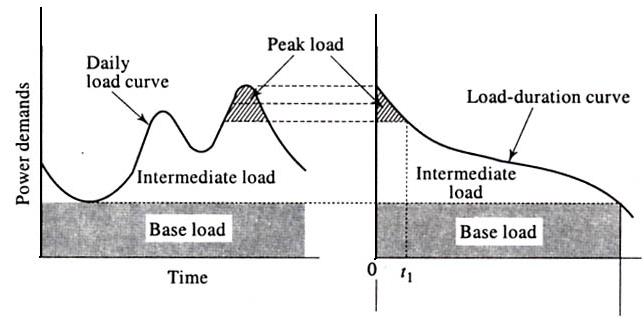
The shape of LDC directly influences technology mix and generation capacity of power plants. When the peak reduces need in thermal plants, which are usually thermal driven, reduces. This reduces gas or oil consumption. On the other hand, when the LDC flattens, base load thermal plants become more efficient. Peak load systems are usually found at the highest magnitudes. This is usually followed by intermediate load and then base load at the bottom. LDC helps in evaluation of reliability systems. In addition, it helps in economic dispatch as well as in system planning. LDC shows the kind of generation technology utilised in the system. From the graph below, it can be noted that LDC shows peak load, intermediate load and base load.
Key features of each of the following
Base load generation
Base load plants are those plants, which accommodate a steady load demand. Such kinds of plants usually run 100 per cent of the duration. The most common power plants utilised in base load are nuclear power plants and coal fired power plants. Base load power plants are usually between about 40 per cent of the maximum load.
Intermediate load following power plants
Intermediate load power plants run throughout the year just like base load plants. However, the former has the capacity to slope up and down rapidly. The plants do this in response to demand changes for energy throughout the day. Intermediate load plants usually have high variable costs as compared to base load plants. Nonetheless, the former have low fixed costs as compared to the latter. An example of intermediate load power plant is a combined –cycle natural gas plant.
Peaking load power plants
Peak load power plants work over short time. In most cases, peak power plants help to surge over temporary demand peak. This is usually 15 per cent in suitable plants. The most common power plants utilised in peak load plants are hydro power plants and gas turbine power plants.
LUECs for each type of generation technology
LUECs for the technologies mentioned is as follows
Conclusion
LDC is a chart that gives an overview of energy demanded by an electricity system. Furthermore, LDC determines the kind of technological mix to be utilised in electricity systems. While base load power plant is steady, peak load and intermediate load plants are flexible.
Bibliography
Al-Shaalan, Abdullah. “Load Duration Curve (LDC).” Web.
EIA. “Annual Energy Outlook 2014.” Web.
El-Masry, Osama. “Load Curves.” Web.
IAEA. “Expansion planning for electrical generating systems.” Web.
OPA. “OPA resources to meet energy needs: base load and intermediate resources.” Web.