Inventory Plan
Developing the inventory plan for the Martin-Pullin Bicycle Corporation will entail estimating the economic order quantity. In this case, the forecasted demand will be used in the model. The simple economic order quantity model ignores the swings in demand. In this model, the variation in demand is reviewed by the use of safety stock and changing the scope of planning. Estimation of the values that will be used in the model is summarized below.
The forecasted demand for the year 2014 is 442
Average demand per month
- = 442 / 12
- = 36.83 bicycles
Standard deviation of monthly forecasted demand
- = 25.23
The inventory plan will be prepared based on the costs that are listed below.
- Order cost = $85 per order
- Cost per bicycle = $250 * 65%
- =$162.5
- Holding cost = 24% * $162.5
- = $39
- Service level = 95% (this match up with a Z value of 1.645)
- Lead time = 4 weeks (1 month)
- Annual demand = 442 bicycles
The economic order quantity (EOQ) model is shown below.
- EOQ = √ [2 * (ordering cost) * (annual demand)] / holding cost
- = √ (2 * 85 * 442) / 39
- = √ 75140 / 39
- = √ 1,926.66
- = 43.89
- ≈ 44 bicycles
Based on the model above, the economic order quantity is 44 bicycles. This plan indicates that the company should make an order of 44 bicycles every time they replenish inventory. This is the value that will minimize the total cost of ordering. Examples of these inventories are holding, shortage, and ordering costs (Drury, 2013).
Reorder Points and Total Cost
A reorder point shows the level of inventory which prompts an act to replenish that specific stock. It shows the minimal level of stock which a company should not go below. The reorder point depends on two main factors that are the average demand and the lead time. A high value of standard deviation of demand is likely to result in a high reorder point (Agrawal, 2014). The calculation for the reorder point is illustrated below.
- Reorder point (ROP) = average demand during lead time * Z * standard deviation of demand during lead time
- = average demand during lead time + safety stock
- = 36.83 + (1.645 * 25.23)
- = 78.33 bicycles
From the calculations above, the reorder point is 78 bicycles. This implies that the company should make an order once inventory reaches this level.
- Safety stock = Z * standard deviation of demand during lead time
- = 1.645 * 25.23
- = 41.503
- = 42
The calculation above shows that the demand during lead time is 37 bicycles while the safety stock is 42 bicycles. It can be observed that the safety stock is quite high as compared to the consumption during lead time. This can be an indication of seasonality in demand.
- Total inventory cost (annual)
- = holding cost + ordering cost
- = ½ EOQ * (holding cost) + safety stock * holding cost + total demand / EOQ * ordering cost
- = (½ * 44 * 39) + (42 * 39) + (442 / 44 * 85)
- = 858 + 1638 + 853.86
- = $3,349.86
Comparison of Reorder Point and Economic Order Quantity
The economic order quantity and reorder point give the company direction on the number of bicycles to purchase every time they make an order. Thus, the ideal quantity to order is referred to as the economic order quantity. From the calculations above, the reorder point is 78 bicycles while the economic order quantity is 44 bicycles. It clearly shows that the reorder point is greater than the economic order quantity.
This implies that the company will be carrying excess inventory as indicated by the high value of safety stock. It may also indicate that the company will have to order several batches to bring the inventory level to a position that is more than the economic order quantity. Therefore, Martin-Pullin Bicycle Corporation cannot afford to be out of stock for bicycles. Stock-out can be detrimental to the company because it may result in a loss of profit. At the same time, making multiple orders increases the cost of ordering and holding cost. Thus, it is important for the company to properly understand the behavior of demand for the entire year so as to come up with an appropriate inventory planning model that caters for the swing in demand (Boyd, 2013).
How to Address Demand that is Not at the Level of Planning Horizon
In order to understand the level of demand that is outside the planning horizon, it will be necessary to draw a graph of the forecasted demand for the year 2014 and the average demand. The graph is illustrated below.
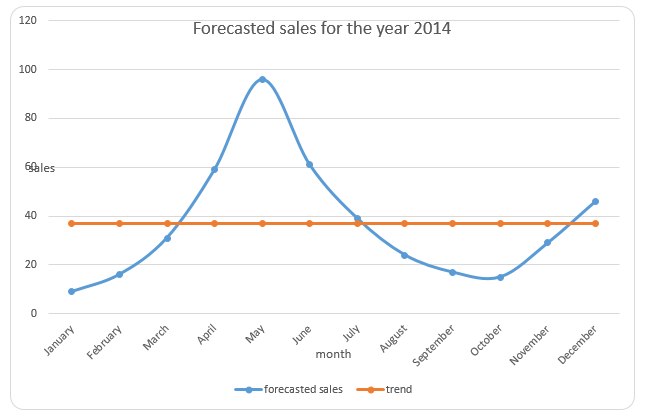
In the graph above, the line in red shows the average of estimated demand for the year 2014. On the other hand, the line in blue shows the values of estimated demand for each month. A review of the graph shows that the demand is not corresponding to the planning horizon. The seasonality of demand is quite evident in the graph as indicated by the swings. Besides, the graph shows that the demand for bicycles grows between January and May.
It reaches peak in May and starts to decline until the month of October and thereafter, it starts to rise. Due to the swings, the economic quantity model is not suitable for the retail sales. This implies that it may not be appropriate to come up with an economic order quantity for the entire year. In order to plan for the demand, Martin-Pullin Bicycle Corporation needs to segment the planning horizon in a manner that ensures that the demand is evenly distributed throughout the entire year. For instance, the company can divide the planning horizon into quarters. Thereafter, inventory planning will be carried out for each quarter (Cabral, 2017).
This approach will ensure that inventory is evenly distributed throughout the entire year. Also, it will eliminate the cost associated with making multiple orders. The main challenge of this approach is that the company may find it difficult to manage the transition from one quarter to the next. Planning for inventory from a season of low demand to a period of high demand may be a challenge to the company. In this case, a graph that shows the behavior of sales may be beneficial to the company. In summary, inventory planning is quite significant because it helps in managing costs and ensuring that there are no stock-outs. However, a company needs to come up with a plan that suits the nature of demand.
References
Agrawal, P. K. (2014). SAP MM inventory management. New Delhi, India: PHI Learning Pvt. Ltd.
Boyd, K. (2013). Cost accounting for dummies. New Jersey, NJ: John Wiley & Sons, Inc.
Cabral, L. M. (2017). Introduction to industrial organization. Cambridge, MA: Massachusetts Institute of Technology.
Drury, C. M. (2013). Management and cost accounting. New York, NY: Springer Publishers.