Balance Scorecard
Developed in the 1990s, the balanced scorecard technique emerged as a holistic strategic management tool for reviewing organizational performance (Jeffs, Merkley, Richardson, Eli, & McAllister, 2011). It encouraged managers to avoid using a narrow assessment of corporate behavior, which is based on financial metrics, and instead develop one that also measures nonfinancial performance metrics (Fields & Cohen, 2011; Kollberg & Elg, 2011). In this regard, the balanced scorecard technique helps to integrate different parts of the strategic planning process to create a broader understanding of how its different tenets support the overall strategic plan (Groene, Brandt, Schmidt, & Moeller, 2009).
As highlighted in previous assignments, the planned changes to be made in the healthcare system include the redesign of the financial payment model and the improvement of systemic operational efficiencies. The aim of introducing these planned changes is to reduce the operating costs associated with healthcare service delivery to make it affordable. This vision can be actualized by promoting efficiencies in the documentation and improving coordination between care delivery and patient-centered activities. Table 1 below highlights the balanced scorecard model that should be used to measure performance.
Balance Scorecard Model
Are Costs Justified In Terms Of Outcomes?
According to Corso, Ingels, Taylor, and Desai (2014), the expenditures associated with making healthcare changes need to be linked with expected outcomes. Based on this analysis, the cost of following the blueprint outlined in the balanced scorecard model (outlined above) justifies the expected outcomes. For example, one of the goals of the balanced scorecard model is to assess patients’ satisfaction levels with the proposed changes.
Measuring satisfaction levels have been included in the balanced scorecard model because it would be difficult to realize operational efficiencies if both patients and workers are dissatisfied with the proposed changes. For example, high employee turnover could impede efforts to improve systemic efficiencies to lower the cost of healthcare (Halter et al., 2017).
Lastly, although assessing all the financial indices highlighted in the balanced scorecard model may require complex accounting procedures, it is essential to measure all of them because they will make sure investors’ interests are protected and the systemic gains made in the past are not undermined or eroded by impending changes. Therefore, the cost of implementing the key tenets of the balanced scorecard technique is justified relative to the expected outcomes. Data that could be used to operationalize the balanced scorecard model may be obtained from several sources, including incidence reports, expert opinions, and management briefs. This type of data would be obtained from websites, libraries, and face-to-face discussions.
Financial Resources for Proposed Change
The financial resources required to implement the proposed changes would be based on grants, debt, and equity models. Grants would be sourced from organizations and government institutions that support research and development (R&D) in the healthcare sector. Comparatively, the debt and equity financing models will be used to secure the support of development partners by allowing them to “own” a part of the proposed changes in exchange for equity or financial returns.
For example, insurance companies and organizations that produce medical equipment could be integrated into the change management plan using these models. In this arrangement, these entities would support the change process by claiming returns from the outcomes. Finding the right model that will suit the interests of each stakeholder group depends on proper management and leadership (Marquis & Huston, 2017).
The profit and loss (P&L) model were used to come up with the above-mentioned resources. This model helps managers to assess the strengths of their proposed plan by reviewing the expected profits and losses associated with the proposed changes (Schakel, Wu, & Jeurissen, 2018). The justification for using the P&L model is hinged on its proficiency in projecting the gains or losses to be made by implementing the planned changes. Therefore, the resources to be integrated into the P&L framework are assessed based on how well they improve patients’ welfare and minimize losses associated with the provision of healthcare services.
Challenges Associated with the Budgeting Process
The budgeting process was hinged on several assumptions. For example, it was assumed that there would be no adverse economic event, such as a global financial crisis or a change in the legal environment, during the implementation of the planned changes. If these assumptions are overlooked, the operating conditions that informed the budgeting process may vary and affect current projections of profit and loss (Sare & Ogilvie, 2010).
The changes may erode the support expected from partners in the change management process. Figure 1 below is a snapshot of the proposed budget for R&D (in excel format) that underpins the implementation of the change management process. The strategic planning process is expected to take 52 months, which start from the year 2019 to 2024 (figures are in billions of dollars).
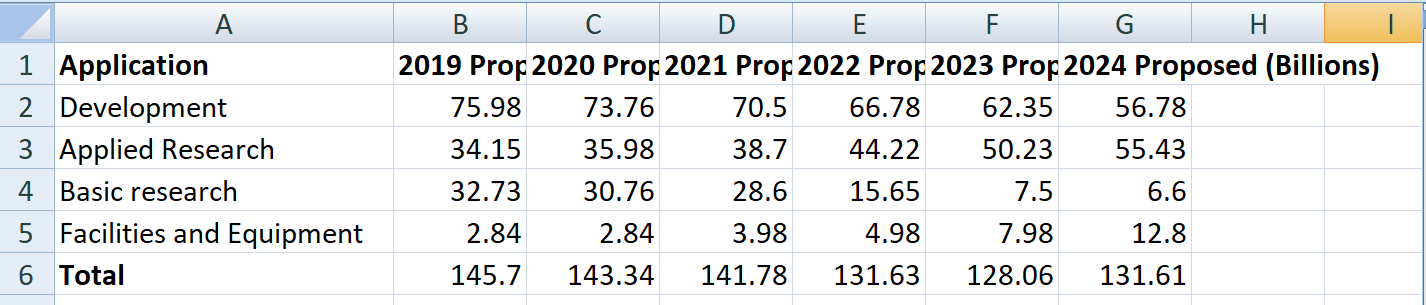
Because the proposed changes are expected to last from 2019 to 2024, it is difficult to account for all economic variations that could happen during this period. The inability to account for this variation emerged as a challenge in the budgeting process.
Timeline for Proposed Changes
As highlighted in this paper, the proposed changes to the healthcare payment model are expected to take up to 52 months to complete. According to the Gantt chart below, which appears as Table 1, there will be six main stages to be completed before the completion of the entire change management process. These stages include staff recruitment, assessment, drafting implementation plan, seeking stakeholder buy-in, lobbying, ratifying changes, and implementation.
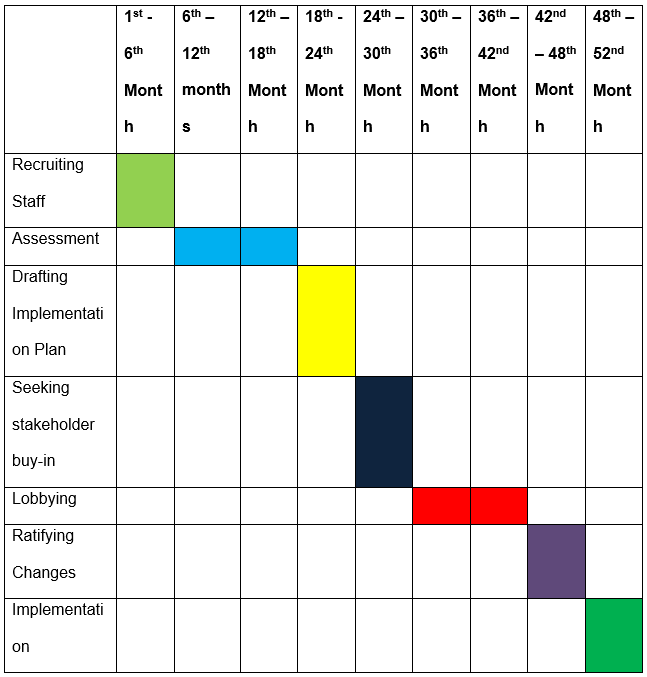
The six phases outlined above for implementing planned changes are all important to the implementation of the proposed changes. However, all of them are dependent on two key stages: assessment and drafting the implementation plan. These two stages are integral in creating the blueprint that would be used to develop the entire strategic plan. Therefore, without them, it would be difficult to undertake other processes.
Although the Gantt chart outlined above is succinct, Yang (2018) cautions that unforeseen factors could affect budget timelines. To account for this risk, the 52-month timeframe developed to complete the changes accommodates unexpected events which could cause disruptions in the overall time plan. Stated differently, each stage is allocated a one-month extended time to account for variations in strategic planning that may overlap onto the next stage. Therefore, it is expected that if unexpected events occur, they would not spill over to a different timeframe allocated for another stage of the strategic planning process.
References
Marquis, B. L., & Huston, C. J. (2017). Leadership roles and management functions in nursing: Theory and application (9th ed.). Philadelphia, PA: Lippincott, Williams & Wilkins.
Sare, M. V., & Ogilvie, L. (2010). Strategic planning for nurses: Change management in health care. Sudbury, MA: Jones and Bartlett.
Schakel, H. C., Wu, E. H., & Jeurissen, P. (2018). Fiscal rules, powerful levers for controlling the health budget? Evidence from 32 OECD countries. BMC Public Health, 18(1), 300. Web.
Yang, C. M. (2018). The impact of global budget on the diffusion of innovations: The example of positron emission tomography in Taiwan. BMC Health Services Research, 18(1), 905. Web.
Corso, P. S., Ingels, J. B., Taylor, N., & Desai, S. (2014). Linking costs to health outcomes for allocating scarce public health resources. Journal for Electronic Health Data and Methods, 2(4), 1128. Web.
Fields, S. A., & Cohen, D. (2011). Performance enhancement using a balanced scorecard in a patient-centered medical home. Family Medicine, 43(10), 735-739.
Groene, O., Brandt, E., Schmidt, W., & Moeller, J. (2009). The balanced scorecard of acute settings: Development process, definition of 20 strategic objectives and implementation. International Journal for Quality in Health Care, 21(4), 259-271.
Halter, M., Boiko, O., Pelone, F., Beighton, C., Harris, R., Gale, J., … Drennan, V. (2017). The determinants and consequences of adult nursing staff turnover: A systematic review of systematic reviews. BMC Health Services Research, 17(1), 824. Web.
Jeffs, L., Merkley, J., Richardson, S., Eli, J., & McAllister, M. (2011). Using a nursing balanced scorecard approach to measure and optimize nursing performance. Nursing Leadership, 24(1), 47-58.
Kollberg, B., & Elg, M. (2011). The practice of the balanced scorecard in health care services. International Journal of Productivity and Performance Management, 60(5), 427-445.