Introduction
Before launching a real ship into the water, tests must be conducted to assess possible risks and potential problems that the ship may encounter during launching. Obviously, such tests consume a considerable number of resources and time, so it is necessary to resort to large-scale modeling with a high degree of accuracy, repeating the processes of towing a ship on a much smaller scale. Such modeling is based on mathematical operations to calculate predictive values of variables, as well as to determine the type of relationship between them. In this report, the simulation was used for a Basis-type ship object with a mass of 1.65 kg. The object was placed in an oblong pool filled with water so that it was kept afloat. At the same time, a thread was attached to the front end of the ship, pulling the ship horizontally along the central axis. For this one-dimensional motion, velocity values at specific points in time were measured using Minitab, resulting in a data table that listed velocity and time values. Based on this data, mathematical analysis was performed to accomplish the following tasks:
- Determine the nature of the relationship between velocity and time and answer the question of whether the relationship is linear.
- Perform regression to determine the relationship between velocity and resistance.
- Determine the quality of the signal using the SNR.
- Perform practical calculations.
Thus, this research report is a sequential work with mathematical operations to the measured data. The report is a valuable material for demonstrating the student’s skills in differentiation and integration as well as working with statistical methods of analysis.
Experimental Procedure
As mentioned above, the primary measurement in this simulation was to collect velocity data as a function of time for a Basis type object. The data was recorded automatically using Minitab and then transferred to MS Excel for analysis. The analysis properly included both a regression test and the construction of visual representations of the dependencies in order to explore the relationships between the variables in greater depth. In addition, manual calculations of differentiation and integration of functions were performed for the report in order to find the necessary expressions and values. A total of five consecutive tests were performed for the horizontal motion of the vessel — of which the data from the fifth test were chosen as the most acceptable and exciting for the analysis. Nevertheless, the report summarizes the results for all five tests where required.
Results and Discussion
The first part of this research report was to use the velocity and time data for a scale model of the ship in order to study the acceleration and distance functions. For this purpose, the original data from the fifth test were trimmed accordingly (see Appendix A) to avoid unnecessary bias and interference: a total of 320 observations were recorded for times ranked from 1.41 to 13.31 seconds. The scatter plot of these data is shown in Fig. 1 below:
As follows from this figure, the velocity is an ascending function up to a particular value of time, but then it does not change much. In other words, this relationship cannot be classified as linear. From a visual point of view, the scale model of the ship starts moving at a uniform velocity from about the sixth second. Meanwhile, this figure also contains information about the regression analysis; namely, it shows the equation of the regression model. The assignment stated that the regression curve should have the best fit, and an estimate of such a parameter is R2. The value of 0.9924 shown in the figure defines an excellent level of fit, which means that this model satisfies the requirement of reliability and increased accuracy (Bloomenthal, 2021). From the equation shown, it can be paraphrased to get the expression for the velocity function of the scale model of the ship:
![]()
The value of the y-intercept when t = 0 is negative for this function. In practice, this would mean that the ship model was moving in the opposite direction before the test began, which is not true and rather determines the error of the regression line (Rajai, 2022). The velocity expression can be integrated to obtain the path function:
![]()
The integration bounds are not chosen by chance: they are the initial and final reference points for the ship’s test, chosen for the analysis (see Appendix A). Accordingly, the search for the velocity function followed by the setting of integration bounds will allow us to obtain the value of the total distance the ship has traveled during this time, namely:
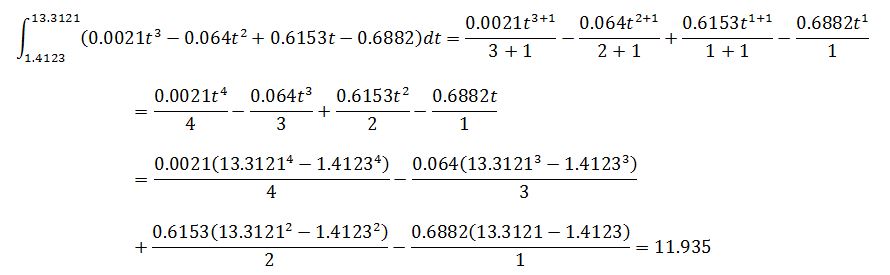
It means that during the elapsed time, the scale model of the ship has passed a total distance equal to 11.935 meters. Limiting the integration on the left side to zero-time value (t = 0), that is, from the very beginning of the test, the total distance traveled will be slightly corrected to 11.518 meters, which is caused by errors in the regression model. This parameter is a reliable result because it is well known that a particular integral of the velocity function determines the area under the curve, equal to the distance traveled. It is worth specifying that similar values can be obtained for all trials, assuming that the velocities in each run changed according to similar functions and the time was the same and that any changes could be due to statistical errors. The original velocity function can be differentiated, which would lead the polynomial in the opposite direction, that is, in the direction of decreasing its degree. This will provide a mathematical expression for the acceleration as a function of time:
![]()
The resulting expression can be used to calculate the acceleration at any point in time within the sample. For example, at t = 0, the acceleration was:
![]()
![]()
Although this was not part of the assignment, it is interesting to evaluate this function in terms of mathematical analysis. In particular, the acceleration here is a quadratic expression, with the branches of the parabola pointing upward because the highest term of the polynomial has a positive value. The function crosses the vertical axis at 0.6153, so it can be cautiously concluded that the acceleration had both a downward and upward trend during this time. However, the acceleration should have been zero under ideal conditions at that point, that is, the model was moving uniformly.
In this part of the assignment, it was necessary to use the velocity and drag data of the scale model of the ship in order to perform a regression analysis. Table 1 below provides information on the five measurement points (see Appendix B) for the V and R/V variables collected:
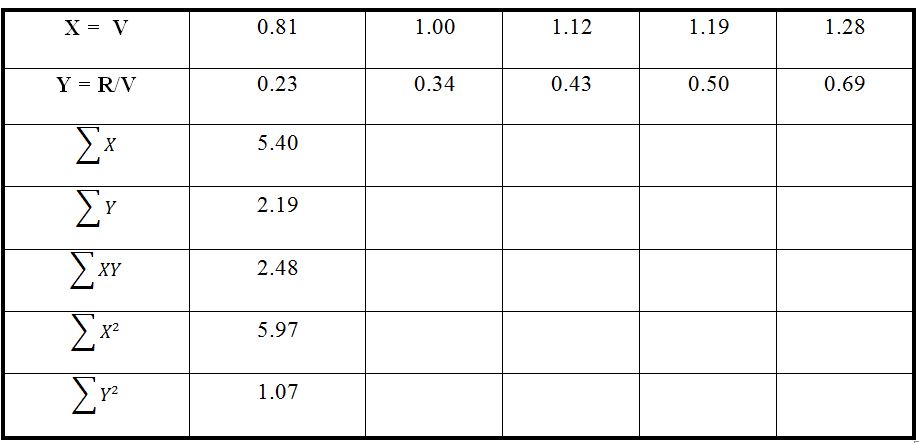
In addition, this table also contains information about the coefficients required to calculate the Pearson correlation. It is appropriate to emphasize here that mathematically, the Pearson correlation corresponds to a parameter of the relationship between two numerical variables, namely direction and strength (Obilor and Amadi, 2018). Evaluating such a parameter allows drawing conclusions about how one variable behaves when the other changes and whether their relationship is strong. The following calculations were used to find the Pearson correlation coefficient:
It is possible to substitute the known values from Table 1:
![]()
![]()
It follows that the correlation between the variables was 0.928. Given that +1 is the upper positive threshold of this parameter, it can be postulated that there is an extremely strong positive relationship between the variables (Obilor and Amadi, 2018). This means that an increase in V leads to a corresponding increase in R/V. Increasing this parameter to the second power gives a coefficient of determination R2, which is 0.8612, which implies that the regression model can cover up to 86.12% of the variance in the data (Bloomenthal, 2021). To assess this dependence even further, a regression analysis is needed: this will determine the numerical influence of one variable on the other (Kumari and Yadav, 2018). To do this, from the already prepared coefficients (Table 1), it can be calculated the slope:
![]()
![]()
The positive value of the slope coefficient determines the upward trend of the linear regression; it follows that an increase in V does lead to an increase in R/V, with this increase being +0.832 in R/V for every one m/s increase in V. At the same time, the y-intercept function determines over any of the set points. For convenience, let us take the last point, namely (1.28, 0.69):
![]()
![]()
The y-intercept of the linear function turned out to be negative, that is, at zero velocity, R/V turns out to be -0.375. However, this does not make sense in the context of the real simulation since R/V should also be equal to zero since there was no resistance in the absence of velocity. This discrepancy is due to statistical error. Then the final linear regression equation is:
![]()
Or in terms of variables used:
![]()
This equation, obtained by manual calculations, can be checked using MS Excel. In particular, the program allows the automatically calculating the regression equation for the variables, as shown in Fig. 2:
As can be seen, the constructed regression equation is similar to the one calculated manually, but there are some deviations. Such differences are due to forced rounding in manual calculations to avoid time-consuming calculations. MS Excel does not round values so much, so the regression equation obtained in Fig. 2 should be regarded as more accurate. Nevertheless, the nature of the relationship, the upward trend, and the overall reliability of the constructed model appear to be close in the two calculation methods.
The third part of this report was to evaluate the reliability of the transmitted signal using SNR. SNR is a measure of signal accuracy and usefulness in technologies, showing the ratio of useful information to noise. In general, the higher this figure, the better the transmission. For the SNR calculations in this part, the fifteen points have been chosen from the area in Figure 1 that is close to the maximum rate. This data is shown in Table 2:
Table 2: Data of fifteen selected points, which are close to the maximum velocity value
The formula for calculating the SNR is as follows:
![]()
It includes the mean value and the sample standard deviation for the velocity data, which means that finding these values is the primary step for calculating SNR. MS Excel allows calculating them automatically:
![]()
![]()
Then SNR equals:
![]()
This indicator defines an extremely high SNR level, which, according to Cisco (2020), indicates that it can be used for the transmission of even sensitive data. In other words, the level of interference in this signal is extremely low.
This part shows practical calculations for a given function of the distance the ship travels:
![]()
The expression for velocity can be obtained by differentiating the above function by time:
![]()
![]()
After six seconds, the velocity will be:
![]()
![]()
The velocity is equal to zero at the following points in time:
![]()
![]()
![]()
![]()
![]()
Since time cannot be negative, the ship’s velocity is zero at 1.884 seconds after the start of the test. The function for acceleration is obtained by differentiating the velocity:
![]()
![]()
And after four seconds, the acceleration is:
![]()
![]()
Time at which the acceleration is zero:
![]()
![]()
Finally, the original equation for distance is used to calculate the total path after ten seconds:
![]()
![]()
Conclusion
In this research report, mathematical operations were performed to study in detail the simulation of the towing of the Basis ship on a water basin. It was shown that the velocity of this ship is not a linear function of time but is well described polynomially. The signal for the data analysis was clean, so the results can be considered dependable. The reliability of the calculations performed is also confirmed statistically: the results of manual calculations did not differ significantly from the automatic calculations in MS Excel and were due to statistical errors. All of the above points to the fact that the objectives of this report have been achieved and the values and conclusions obtained can be used in further ship design.
Reference List
Bloomenthal, A. (2021) Coefficient of determination. Web.
Cisco (2020) Signal-to-noise ratio (SNR) and wireless signal strength. Web.
Kumari, K. and Yadav, S. (2018) ‘Linear regression analysis study’, Journal of the practice of Cardiovascular Sciences, 4(1), pp. 33-36.
Obilor, E.I. and Amadi, E.C. (2018) ‘Test for significance of Pearson’s correlation coefficient’, International Journal of Innovative Mathematics, Statistics & Energy Policies, 6(1), pp. 11-23.
Rajai, A. P. (2022) Can velocity be negative: why, when, how, different scenarios and problems. Web.
Appendix: Velocity and Time Data Used for the Analysis
Velocity and Resistance Data