Descriptive statistics
Measures of central tendency and dispersion constitute descriptive statistics, which are applicable in the summarization of collected data. Fundamentally, descriptive statistics provide a way of summarizing and describing data because they indicate patterns and trends. According to Jackson (2012), descriptive statistics are relevant in data analysis because they present raw data in a simplified form, which is critical in enhancing interpretation. Mean, mode, and median are measures of central tendency because they measure the distribution of data around a central value. Range, standard deviation, maximum value, and the minimum value are measures of dispersion because they indicate the degree of variation of a given data from a central value. Therefore, this essay examines assumptions of descriptive statistics and analyzes data derived from General Social Survey (GSS).
Assumptions
In the analysis of descriptive statistics (measures of central tendency and dispersion), the data must meet three main assumptions. The first assumption is that the data must exist on a continuous scale, such as a ratio scale or interval scale. Mean and standard deviation are robust measures of central tendency and dispersion respectively, which require data on a continuous scale. The second assumption is that the data should follow the normal distribution. The distribution of data determines the accuracy of mean and standard deviation because skewness gives biased values. The third assumption is that there should be no significant outliers because they influence the range, median, mode, maximum value, and minimum value. Hence, for descriptive statistics to give meaningful results, the data must comply with the assumptions stated above.
Table 1:
Interpretation of analysis
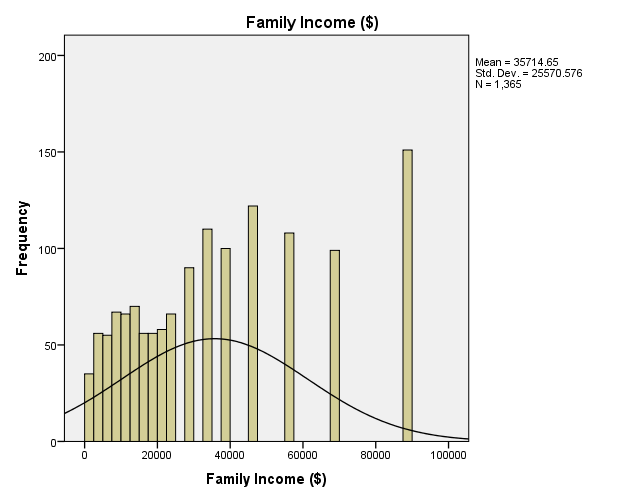
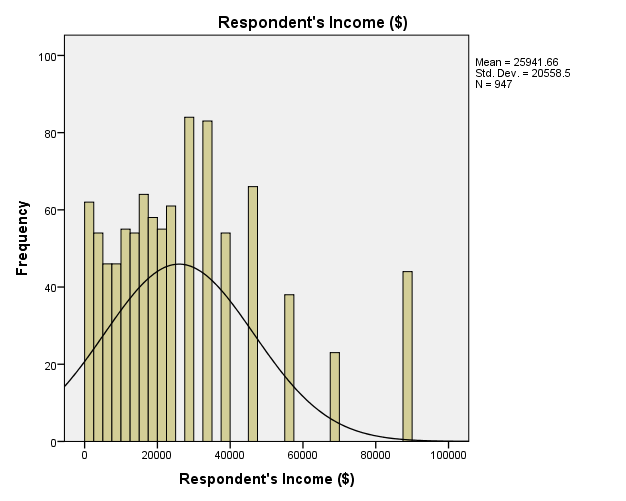
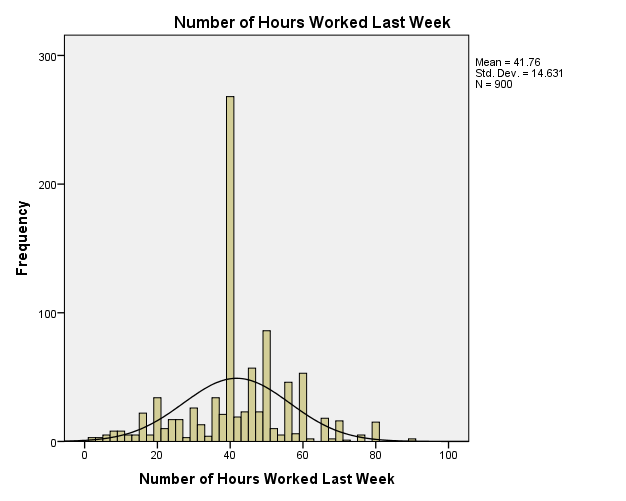
The GSS has data of age of respondents, family income, respondents’ income, and the number of hours worked in a week. Descriptive statistics indicate that the mean age of respondents is 46.23 and the standard deviation is 17.418 (M = 46.23, SD = 17.418). The range of the ages is 71 as the minimum age is 18 and the maximum age is 89 with most respondents having the age of 28 (Mode = 28). The descriptive statistics of family income show that the mean is $35,714.65 and the standard deviation is $25,570.576 (M = $35,714.65. SD = 25,570.576), with most families earning $87,500 (Mode = $87,500). Comparatively, descriptive statistics of respondents’ income depicts that the mean is $25,941.66 and the standard deviation is $20,558.5, with most respondents earning $27,500 (Mode = $27,500). Family income and respondents’ income have the same range of $87,000, with the minimum income being $500 and the maximum income being $87,500. Descriptive statistics of the number of hours worked in a week show a mean of 41.76 hours and a standard deviation of 14.631 hours (M = 41.76, SD = 14.631). The range of hours worked in a week is 87 hours for minimum hours is 2 and maximum hours is 89.
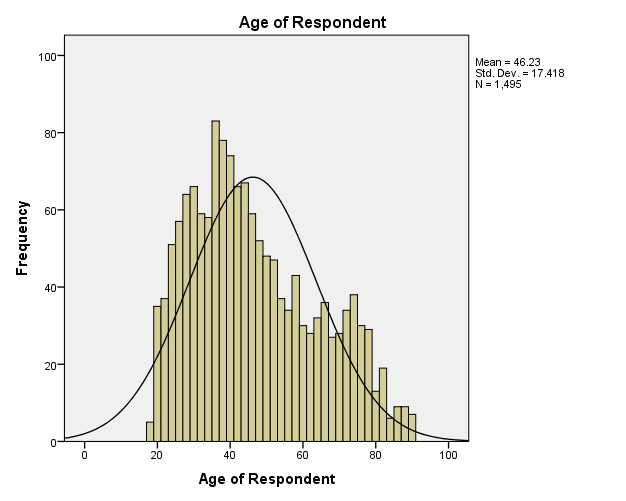
Figure 1 is a histogram, which indicates the distribution of respondents according to their ages. Field (2013) states that the closer the distribution of data to the normal distribution, the higher the degree of representation of the population. In this view, it is apparent that the distribution of respondents according to their ages reflects the population.
References
Field, A. (2013). Discovering statistics using SPSS (4th ed.). London: SAGE Publisher. Jackson, S. L. (2012). Research methods and statistics: A Critical Thinking Approach (4th ed.). Belmont, CA: Wadsworth.
Appendices
Additional Graphs
Syntax Output
Table 2: