Introduction and assumptions
The paper will analyze the relationship between the highest level of education, labor force status and the number of hours worked in a week. The paper will concentrate on estimating the measures of central tendency and dispersion (Arnold, 2011). The data will be collected from NORC at the University of Chicago website which provides data on the general social survey (NORC at the University of Chicago, 2015). Further, the data will cover the period between 1972 and 2014. The analysis will be based on assumption that the level of education has a direct impact on labor force status and number of hours worked (Verbeek, 2008; Baltagi, 2011).
Data set and SPSS results
The variables that will be analyzed are labor force status, number of hours worked in a week, and the highest degree attained by the respondent (Bade & Parkin, 2013).
Discussion of results
Mean, median, and mode
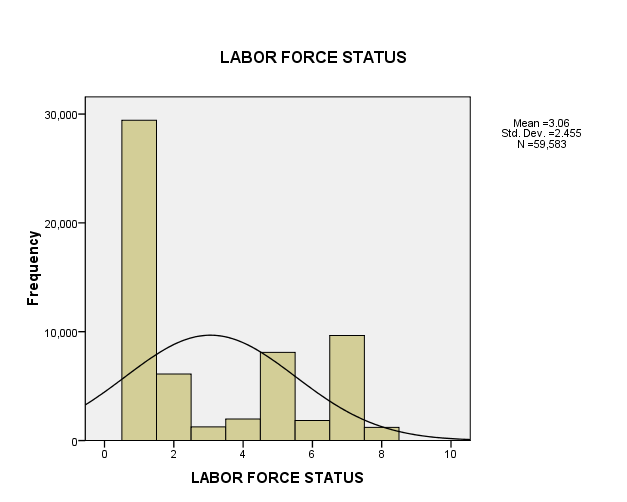
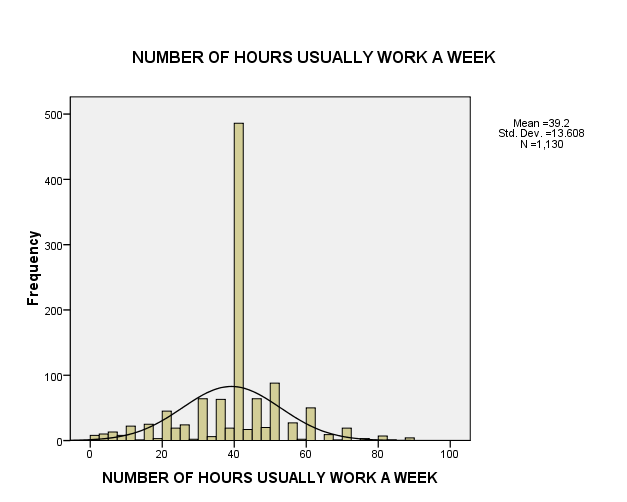
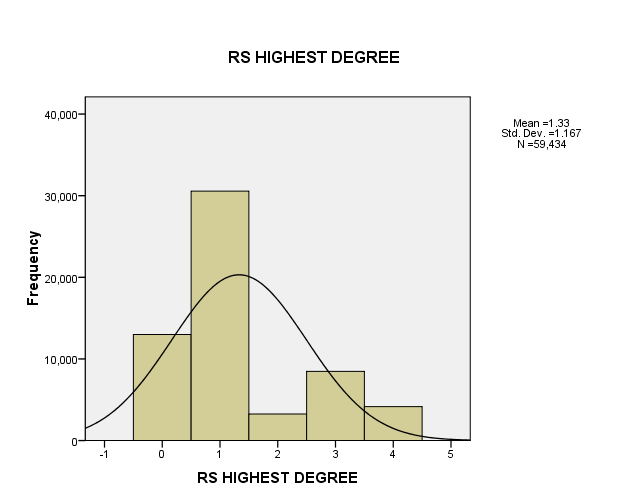
The mean value of labor force status is 3.06. The average number of hours worked per week is 39.20 and the mean value for highest degree is 1.33 (Green & Salkind, 2014). The median labor force status is working part time. Further, the median number of hours worked in a week 40. The median value of the highest degree is 1. It represents LT high school. The modal labor force status is working full time while the modal number of hours worked in a week is 40. Finally, LT high school is the modal highest degree (Field, 2013).
Minimum, maximum, and range
The minimum value of labor force status is 1 while the maximum value is 8. The values can be attributed to the coding of the various labor force status. This yields a range of 7. The minimum number of hours worked in a week is 0 while the maximum number is 89 (Greene, 2011). The resulting value of range is 89. Further, the minimum value of highest degree is 0 while the maximum value is 4. The resulting range is 4. The values are attributed to the coding of the different levels of degree (Frankfort-Nachmias & Nachmias, 2008).
Standard deviation
The number of hours worked has the highest standard deviation of 13.608, followed by labor force status with a value of 2.455. Highest degree has the least value of standard deviation with a value of 1.167 (Mankiw, 2011).
Results
Summary of descriptive statistics
Frequency
Histogram
References
Arnold, R. (2011). Economics. USA: Cengage Learning.
Bade, R., &Parkin, M. (2013). Essential foundations of economics. USA: Pearson Education.
Baltagi, B. (2011). Econometrics. New York: Springer Publishers.
Field, A. (2013). Discovering statistics using IBM SPSS statistics. London: SAGE Publication.
Frankfort-Nachmias, C., & Nachmias, D. (2008). Research methods in the social sciences (7th ed.). New York: Worth.
Green, S. B., & Salkind, N. J. (2014). Using SPSS for Windows and Macintosh: Analyzing and understanding data (7th ed.). Upper Saddle River, NJ: Pearson.
Greene, W. (2011). Econometric analysis. NJ, USA: Pearson Education.
Mankiw, G. (2011). Principles of economics. USA: South-Western Cengage Learning.
NORC at the University of Chicago. (2015). General social survey – get the data. Web.
Verbeek, M. (2008). A guide to modern econometrics. England: John Wiley & Sons.