Population Mean
Definition
The population mean is the average of all samples included in the study (Rubin, 2012). To retrieve the population mean, one must add all values and divide them by their number. Being rather basic, the given type of measurement is used in a variety of cases. For example, when there is a need to identify the average age of the group participants, the population mean can be used (Groeber, Shanon, Fry, & Smith, 2014).
Example
 = 10.
= 10.Sample Mean
Definition
The sample mean, in its turn, is typically interpreted as the mean of the values included in the sample divided by the sample size. Although the specified term is very close to the population mean, there is a major difference between the two. Particularly, the population mean value is related to the entire range of variables included in the study. the sample mean, in its turn, is calculated for a specific sample taken from the array of variables available.
Example
 = 2.7.
Median
Definition
A median is typically referred to as the value that divides the sample in two halves (Jackson, 2013).
Example
 9=4.5. Rounding the number to 5, one will have to find the average of the 4th and the 5th numbers in the data set:
 =9.5.
=9.5.Skewed Distribution
Definition
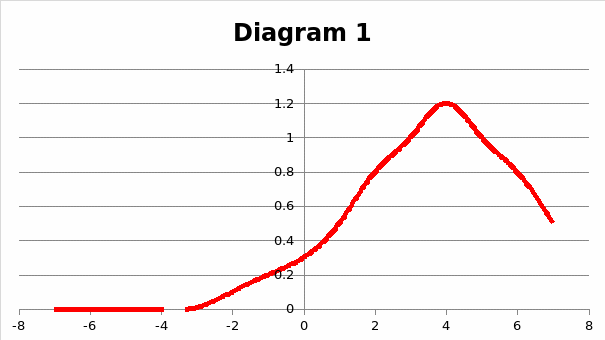
In the skewed distribution, the data is unevenly distributed around the center.
Example
Skewed distribution can be used in the instances that require random value collection. In this scenario, retrieving skewed data is rather probable (Vito & Higgins, 2014).

Symmetric Distribution
Definition
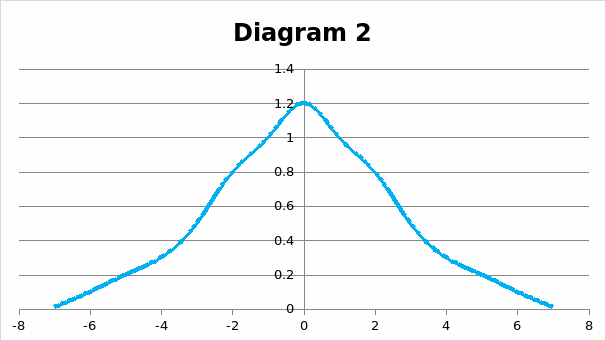
In the symmetric distribution, the data is arranged symmetrically around the center. The symmetric distribution is, therefore, opposed to the skewed one.
Example
The figure below is a typical example of symmetric data. The left and the right sides of the graph are symmetrical to each other.

Mode
Definition
The concept of a mode is traditionally rendered as the tool for measuring the central location of a particular set of values. Although often confused with a mean, it, in fact, has very little to do with the concept of an average number. As a rule, a mode is rendered as the data that can be encountered most frequently on a specific slot.
Example
Supposing, there are ten teams working on a conveyor belt in a factory. The percentage of defects occurring during the performance of the teams is 2%, 2.1%, 2.2%, 2.8%, 3.3%, 3.5%, 4.2%, 4.2%, 4.4%, and 4.5% correspondingly. In the data provided above, the following piece of information occurs most frequently: 4.2%. Therefore, 4.2% is the mode in the identified data set.
Reference List
Groeber, D. F., Shanon, P. W., Fry, P. C., & Smith, K. D. (2014). Describing data using numerical measures. In Business statistics (9th ed.) (pp. 85-145).Upper Saddle River, NJ: Prentice Hall.
Jackson, S. L. (2013). Statistics plain and simple. Boston, MA: Cengage Learning.
Rubin, A. (2012). Statistics for evidence-based practice and evaluation. Boston, MA: Cengage Learning.
Vito, G. F., & Higgins, G. E. (2014). Practical program evaluation for criminal justice. New York, NY: Routledge.