Performance of the stock
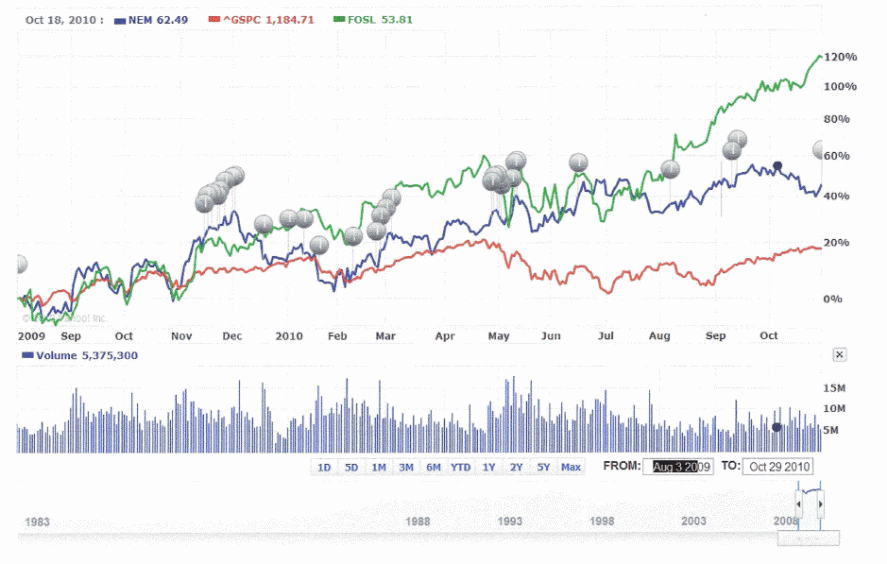
The graph below shows the performance for the stocks of Newmont Mining Corporation and Fossil incorporated as well as the market. It shows that Newmont Mining Corporation was doing well in the market as compared to Fossil incorporated. Both their performance is in upward trend apart from one or two occasions where it went down, although the rate of growth varies.

The performance of my stock can be said not to be doing well because it has low risk as compared with the risk of Fossil, Inc. The standard deviation of Newmont Mining Corporation is 1.5963 with a mean of 0.16012 while Fossil, Inc. has a standard deviation of 1.93915 with a mean of returns of 0.6244. From the standard deviation and mean it appears that my stock is performing poorly as compared to Fossil, Inc stock. In investment, the higher the risk the higher the return.
The standard deviation of a stock measures the systematic risk. In consideration of the above factors, an investor is supposed to select a stock that gives a higher return but this is subject to the investor’s behavior towards risk.
Looking at the correlation of the stocks which is 0.01576 I will conclude that the stocks are positively correlated. Because when stocks are correlating with 0 they are said not to be related while those with the correlation of 0 to -1 are said to be not related and they are performing towards a different direction. Those stocks with a correlation coefficient of 0 to 1 are said to be related but their performance may not be the same. The coefficient of correlation measures the relationship between the two stocks.
Performance measurement
In my initial recommendation, I had chosen Newmont Mining Corporation as the best stock to invest in. However, I will evaluate this decision using portfolio performance measurement measures such as Treynor Index, Jensen’s performance measure, and Sharpe Index or ratio. From the calculations in Excel Sharpe Index for Newmont Mining Corporation is 0.09091 while Fossil, Inc. was 0.31430 and the market had 0.07201. It shows that Fossil, Inc. had a higher return to the risk relative to the market index as compared to Newmont Mining Corporation. Using this criterion I will state that my evaluation initially was wrong. These ratios have been calculated as shown below.
Sharp ratio of Newmont Mining Corporation = (0.1601201-0.015)/1.59628=0.09091
Sharp ratio of Fossil, Inc. = (0.624473-0.015)/1.93915=0.31430
Sharp ratio of S&P500= (0.083394-0.015)/0.949792=0.07201
Using Jensen’s Alpha you will find that Fossil, Inc. performed better than Newmont Mining Corporation. This is because Newmont Mining Corporation has an alpha of 0.11842 while Fossil, Inc. had an alpha of 0.55851. Alpha measures the excess return above or below the security line market. In other words, it shows how the stock outperformed the market. If the alpha is higher than the market it is better for that stockholder because the stock performed well or provided a higher return as compared to the market given a certain systematic risk. In this case my stock was beaten by Fossil, Inc. This has been calculated as shown below:
Alpha Newmont Mining Corporation=0.1601201-[0.015+0.390329(0.083394-0.015)] =0.11842
Alpha Fossil, Inc. =0.624473-[0.015+0.7450715(0.083394-0.015)] =0.55851
The last measurement tool I am considering is Treynor Index which measures the return that is adjusted for systematic risk. It is a reward to risk ratio because it considers total risk as opposed to alpha that considers only one risk. In this case, Treynor for my stock is 0.37179 while for Fossil, Inc. is 0.7450715. The higher ratio means the stock with a higher ratio performed better than the stock with a lower ratio. Therefore this stock, Fossil, Inc. performed better than my selected stock. These ratios have been calculated as shown below:
Treynor Newmont Mining Corporation= (0.1601201-0.015)/0.390329=0.37179
Beta of Newmont Mining Corporation is 0.390329
Treynor Fossil, Inc. = (0.624473-0.015)/0.7450715=0.81801
Beta of Fossil, Inc. is 0.7450715
Treynor S&P500= (0.083394-0.015)/1=0.06839
From the above analysis I will be persuaded to conclude that initially, I made a wrong selection because it is outperformed by Fossil, Inc. All the three performance measurement tools have indicated that Fossil, Inc. is a great performer as opposed to my stock.
Factors that contributed to stock price changes in Newmont Mining Corporation
The changes in prices of Newmont Mining Corporation have been contributed by the information that is been filtered into the market. The stock is improving in its performance because of the information that reached in the market relating to their activities. Being a gold miner in the world, the prices of gold influenced the stock prices.
Information that was filtered to the market
From the month of August 2010 New Mont has released various information to the market which triggered the changes in prices. Some of the information which triggered changes in prices includes;
- On August 26 the company released information collecting claims that were been made about destiture shares
- on 22 October the company was included in the Dow Jones sustainability index
- On October 12 the company announced it starts quarter earnings report which was impressive.
- On 25 October the company was declared the best supplier in the United State.
- On 27 October, the company made a declaration of quarterly dividends.
- On 2 November, the company declared that their income had increased by 38% for the third quarter and
- On November 8 the company acquired a shareholding in Eurasian
Summary
My recommendation of Newmont Mining Corporation having the best stock for investment was wrong because the analysis using the standard deviation, correlation of coefficient, Alpha, Treynor Index, and Sharpe Ratio shows Fossil, Inc. to outperform my stock. These measures of performance have shown that Fossil, Inc. stock performed well in the market and it deserved to be analyzed and purchased. I will change my decision given the second chance of selecting the stock.