Introduction
Analyzing data is of the essence in science (Campbell & Stanley, 1963). This paper supplies an analysis of covariance (ANCOVA) for the data from the file “Stalker.sav,” which can be found on the web page labeled “Datasets” (n.d.). After stating and testing the assumptions for ANCOVA, the author provides the SPSS syntax, SPSS output, and the main tables with results of the test, as well as the results discussion.
Review of American Psychological Association ([APA], 2010) Guidelines
APA (2010) offers certain guidelines for reporting results of statistical tests; the results section should state the type of the test, a concise description of the sample, as well as the report about the results of the study itself. The report is to contain the main statistics derived from the study, such as the F-values, the p-values, degrees of freedom, the effect sizes, and the results of the post-hoc tests.
Review of Chapter 12 (Field, 2013, pp. 478-506)
Field (2013) provides a concise explanation of what ANCOVA is and when to use it, proceeds to its comparison with the general linear model and offers a number of examples. After that, the assumptions of ANCOVA and the ways to address their violation are elaborated. Further, the general procedure of carrying out ANCOVA in SPSS is described, and the manner in which these results should be interpreted is shown. Next, the ways of testing the assumption of homogeneity of regression slopes are described, and the methods to compute the effect size are supplied. Finally, the manner of reporting results is elaborated, and a number of tasks are provided (Field, 2013).
Underlying Assumptions for an ANCOVA
Conducting an ANCOVA requires a number of assumptions to be met (Trochim, 2006; Warner, 2013; Field, 2013):
- The covariate and dependent variables should have an approximately normal distribution; the relation between these variables should be linear;
- The variance of the values should be “reasonably homogenous across groups” on the treatment variable (Warner, 2013, p. 694);
- The covariate ought to be independent of the treatment;
- The treatment variable and covariates should not be strongly confounded; meaningful results can only be obtained when the correlation between them is only weak or moderate;
- There should be no interaction between the treatment and covariates, or, in other words, “the slope for the regression prediction of Y [the dependent variable] from XC [covariates] is the same within each group included in the A [treatment] factor” (Warner, 2013, p. 694). This is also called the homogeneity of regression (Field, 2013);
- Covariates ought to be measured in a highly reliable manner.
Testing the Assumptions and Addressing their Violations
Checking the Assumptions
- Assumption 1. It can be tested by examining the histograms and the scatter plot in Appendix 1. Apparently, the distribution is not excessively non-normal in both cases. However, there are two outliers on the second histogram. The relationship is also very close to linear, especially if the outliers are to be removed.
In the further analysis, the two outliers shown on the second histogram were removed.
- Assumption 2. It can be tested by using Levene’s test for homogeneity of variances:
Because in both cases the Levene’s test is not significant, the variances are found to be homogenous across groups.
- Assumption 3. This can be tested by running a one-way ANOVA which uses the Group variable as a predictor and the Stalk1 (covariate) as the outcome; see Appendix 2. It can be seen that ANOVA in this case is not significant, p=.827, so the difference in the means of the covariate variable across groups is also not significant; thus, the covariate is independent of the treatment.
- Assumption 4. This assumption is tested by running a general linear model in which a requested custom model with interaction terms is included. If the results of the interaction are not significant, the assumption is not violated (Warner, 2013, p. 697).
As it can be seen from the table, the significance of the interaction between the independent variable and the covariate is not significant (p=.452), which means that the assumption is not violated.
- Assumption 5. This assumption is tested by creating a scatter plot for both groups of participants, where the covariate is placed on one of the axes, the outcome is placed on the other one, and the slopes for the two groups are compared (Field, 2013). The result is as follows:
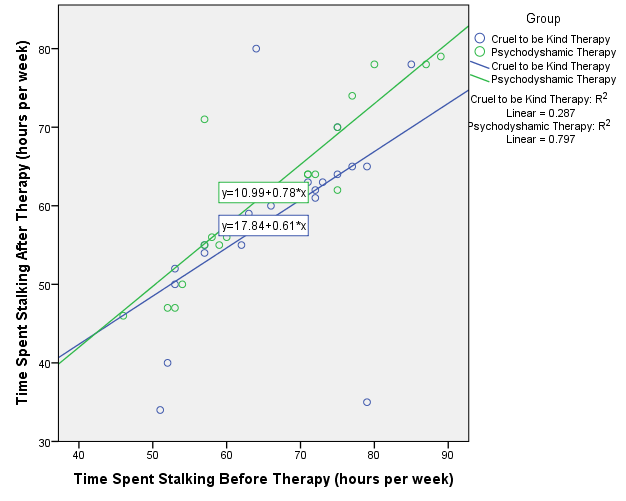
The scatter plot shows that there is a difference in slopes for the covariate and the outcome. However, according to Field (2013), this may be regarded as an assumption of the data. Otherwise, to properly deal with the heterogeneity of slopes, it is possible to use multilevel linear models (Field, 2013). It is also possible to simply not include the covariate in the analysis and run a one-way ANOVA, but this will not be done in this paper.
Addressing Violations
- Assumption 1. The two outliers belonging to the first group, where Stalker1=47 and Stalker2=11, and where Stalker1=50 and Stalker2=18, were removed from the data set for the further analysis. However, this resulted in inequality in sizes among groups, as well as possibly in altering the observed effect of the therapy provided to the first group in the subsequent calculations. In the case of non-normality of distribution, it is possible to adjust the data by raising all the values to the same power.
- Assumption 2. A violation of the assumption of homogeneity of variance can also be addressed by raising all the values to the same power.
- Assumption 3. To make sure the covariate is independent of the treatment, it is necessary to measure the covariate prior to using the intervention.
- Assumption 4. If the treatment and the covariates are strongly confounded, it is usually pointless to conduct an analysis of such data. Other procedures might be suggested instead (Warner, 2013).
- Assumption 5. As it was noted, in case of violation of this assumption, a one-way ANOVA can be run instead of an ANCOVA.
Null and Research Hypotheses for the Test
The null hypothesis for the ANCOVA is that there is no significant influence of type of treatment as described by the variable group on the outcomes of treatment as described by the variable stalk2 controlling for the prior levels of engagement in stalking as described by the variable stalk1.
The null hypothesis for the ANCOVA is that there is a significant influence of type of treatment as described by the variable group on the outcomes of treatment as described by the variable stalk2 controlling for the prior levels of engagement in stalking as described by the variable stalk1.
Syntax File
The contents of the syntax file can be found in Appendix 3.
SPSS Output
Full SPSS output can be found in Appendix 4.
Results Tables
These tables can be found in Appendix 5.
Results
Thus, an analysis of covariance has been carried out to check whether there is a significant relationship between the type of treatment as described by the variable group on the outcomes of treatment for 50 persons receiving stalking therapy as described by the variable stalk2 controlling for the prior levels of engagement in stalking as described by the variable stalk1.
Preliminary data screening revealed two outliers that were removed from the data. In addition, the assumption of homogeneity of regression was violated; however, no specific measures were implemented to address this issue.
Significant influence has been found between the variables in the “corrected model” row, that is, the influence between the predictor variable and the dependent variable: F(2)=23.721, p<.0005. The effect size as estimated by partial η2 was.513, which is a large effect size. The observed power was >0.999, as calculated at α=.05. The mean difference was found to be 3.828 (95% CI: from -.488 to 8.143); however, the level of significance was marginal (p=.081).
Simultaneously, the covariate also significantly influenced the outcomes of therapy: F(1)=44.978, p<.0005. The effect size as estimated by partial η2 was.500, which is a large effect size. The observed power was >0.999, as calculated at α=.05.
Therefore, it can be concluded that evidence has been found to support the alternative hypothesis that the type of therapy significantly predicted the outcomes of therapy, and that the covariate (levels of stalking prior to the therapy) also significantly affected the outcomes of the therapy.
References
American Psychological Association. (2010). Publication manual of the American Psychological Association (6th ed.). Washington, DC: American Psychological Association.
Campbell, D. T., & Stanley, J. C. (1963). Experimental and quasi-experimental designs for research. Boston: Houghton Mifflin.
Datasets. (n.d.). Web.
Field, A. (2013). Discovering statistics using IBM SPSS statistics: And sex and drugs and rock’n’roll (4th ed.). Thousand Oaks, CA: Sage Publications.
Trochim, W. M. K. (2006). Covariance designs. Web.
Warner, R. M. (2013). Applied statistics: From bivariate through multivariate techniques (2nd ed.). Thousand Oaks, CA: SAGE Publications.