Introduction
Macquarie University scientists are researching on a new protein assigned the name Damini.The source of this protein is a marine organism. The researchers still do not know the full genetic make up of this organism. This has necessitated the cloning of the gene coding for this protein in Escherichia coli to provide the required quantities for research. The protein sequence was tagged on the histidine residue at the N-terminus to make purification easier.
Three techniques were applied in order to purify and analyze this protein. Firstly, Immobilized metal affinity chromatography (IMAC) was applied for the separation of the protein. In this technique, separation is achieved by application of chelating group attached to a transition metal ion (Cu, Ni, Zn, Co, Fe).These are Lewis-acids as they act as electron acceptors.O,N and S are electron donors placed in the chromatographic column support.
These electron donors form chelates with metals. The site, which is normally attached to water molecules can easily exchange with proton-electron donor groups on presentation. The work of the histidine residues is to preserve the neighboring aromatic side chains.Adsorption of the protein to the IMAC is promoted when the imidazole residue is not in the protonated form. Finally, the preferred protein is eluted when the metal ions are extracted followed by ligand exchange and protonation (Gaberc-Porekar and Menart, 2001).
The other technique being employed nowadays is the use of Sodium dodecyl sulfate polyacrylamide gel electrophoresis (SDS-page).This is used to determine the molecular weight of the protein under study like Damini.In addition, SDS-page can be used to study an oligometric protein with polypeptide chains similar to those of the protein under study. The purity and mass of the protein can be established (Lehninger,1993).
In SDS, the major principle applied is the destruction of the protein’s secondary, tertiary or quaternary structure (Mathews, 2000).The binding of the protein with the negatively charged SDS molecules creates a density of charges. The charge density formed is independent of the polypeptide’s mass or structure(Sheehan, 2000).Thus, the key factor that controls the elution of particles from the column is the polypeptide’s molecular mass.
The characteristics of our protein can also be determined by size exclusion principle (SEC).It is also called gel filtration chromatography. In this technique, the major principle used is separation of proteins according to their hydrodynamics volumes. The column is packed with polymer beads developed to have different pore sizes. The solution containing the protein under study is passed through the column. The large proteins are excluded from the pores while small particles pass into the pores.
Hence,the large proteins are eluted first.Originally,starch was the main material used as the matrix for separation of sugars, amino acids and proteins.Subsequently,dextran was employed in place of starch (Kunji et al., 2008).The major disadvantage of SEC is that it has low resolution. Thus, it is only applied at the end for purification where proteins are collected and oligomers are eventually separated (Sheehan, 2000).
The main aim of this experiment was to show how the His- tagged Damini protein was isolated from the crude cell Lysate using affinity chromatography technique. After the protein was isolated, a UV spectrum of the protein was run to determine the yield.Moreover, SEC would be used to determine the protein’s molecular size.Thereafter, the results would be compared to those obtained from SDS-page.
Methods
Affinity chromatography
The following binding buffer and elution buffer solutions were used:
- Binding buffer solution A: 20 mM Tris buffer of pH 8, 200 mM NaCl, and 40mM imidazole.
- Elution buffer solution B: 20 mM Tris buffer of pH 8, 200 mM NaCl, and 500 mM imidazole.
In this practical, the Ni-NTA affinity matrix was used. The provided Ni-NTA affinity matrix had already been prepared by washing eight times. The affinity matrix was then washed twice more using the binding buffer solution A and the matrix was left to settle. The supernant obtained with each wash was discarded. After the washing steps were completed, the matrix was transferred to single 50 ml Falcon tube and 8ml of bacterial lysate was then added.
The sample was then placed on a shaker for ten minutes. This was followed by the addition of 10 column volumes of binding buffer solution A. This process was repeated three times. During each washing step, all the liquid was poured into the gravity column and then washed three times using solution A. After this, the Damini protein was assumed to be attached to the matrix. The protein was then eluted using elution buffer B.As a result, 500 µl of fractions (8 eppendorf tubes) were collected.
To determine if the required Damini protein had been obtained, 250µl of Bradford reagent was added to the sample (eppendorf tubes no. 2,3 and 4) from the collected fraction and a change in color was observed( the sample color changed from brown to blue).The change in color as above indicated the presence of the desired protein. To determine the yield of the Damini protein obtained, eppendorf tube number 4 which was assumed to have the highest numbers of protein(according to the color intensity) was used to prepare two sets of dilutions as below and their absorbance was measured at 280 nm.
Dilutions
- 1/ 100 dilution: 2 µl of protein + 198 µl of solution B.
- 1/10 dilution: 20 µl of protein + 180 µl of solution B.
SDS-PAGE
An aliquot of SDS-PAGE was prepared by mixing 40 µl of pure protein with 40 ml of sample buffer. Five microliters of molecular weight marker was then added followed by 10 µl of lysate and 5 µl purified Damini. The gel was run at 200V for 30-40 minutes until the sample entered the gel. The gel was then fixed by a fixer solution of acetic acid and methanol for 10 minutes. Coommasie brilliant blue dye was used to stain the gel. The Damini protein molecular weight was finally determined by comparing it to the standard molecular weight markers.
Size Exclusion Chromatography
This step was used to determine the size of the protein (Damini). A solution that had known standards such as Blue dextran, Ferritin, Aldolase, Ovalbumin and RNase was used. The solution was then run on a superdex 200 (10/300) GL column followed by the sample that was obtained from affinity chromatography that had the desired protein (Damini). The molecular weight of the Damini protein was then calculated from the standard curve.
Results
Affinity Chromatography
During this step, the Damini protein was purified by affinity chromatography. The concentration of the protein was obtained by UV spectrometry using the dilutions of 1/100 and 1/10 with solution B.This was measured in comparison to the blank solution (solution B) using plastic curvettes.The absorbance of the protein was measured using a cell path length of 1 cm and the results below were obtained:
- 1/100 dilution: 0.137A
- 1/10 dilution: 1.169A
SDS-page
This technique was employed to establish the molecular weight of Damini. The crude lysate and purified Damini were both run and compared to molecular weight marker. (Figure 2 shows the result for Apache group name):
Size exclusion chromatography
The size of our protein was determined by comparing it with other proteins of known molecular weight, which was derived from the calibration graph. The proteins of known molecular weight were mixed together in a solution.These were:
Blue dextran 2000 KDa, Ferritin 440 KDa, aldolase 158 KDa, Ovalbumin 43 KDa and RNase A of 13.7 KDa.
A Chromatogram was obtained from running the solution through size exclusion chromatography column (Figure 3):
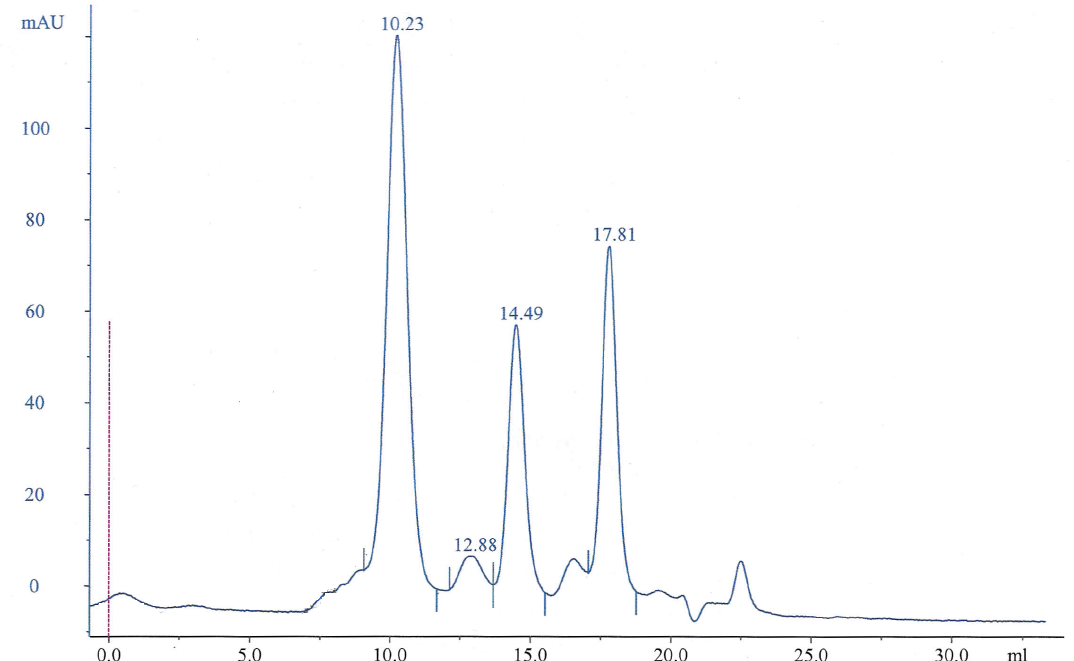
In the chromatogram, each peak represents the elution volume of the protein (Ve). Each peak represents each of the proteins used. Since the size of the proteins is related to their masses, then the elution will start with the heaviest protein to the lightest one. Thus, the peaks are related to the mass of each protein. The first peak represents the protein with the highest molecular weight, which is the blue dextran 2000 KDa, and the last peak represents RNase A with 13.7 KDa.
The void volume (Vo) or the elution volume was given in the practical for blue dextran because it was large enough to make it pass through the column without being affected. The Kav for each of the five proteins would be calculated using the equation below.
The Damini protein was also run through the SEC column the chromatogram below was obtained.
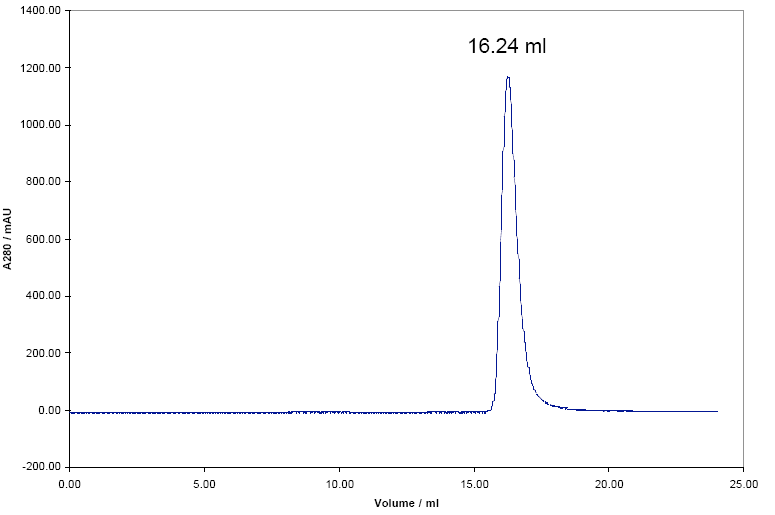
The elution volume of the Damini shown in the chromatogram is 16.24 mL, therefore the Kav will be equal to: (Ve-Vo) / (Vt-Vo)
Discussion
Affinity chromatography
Using the absorbance obtained from the two diluted sets, the concentration of Damini can be determined using the Beer-Lamberts law: A=εC
l = 1 cm and ε= 15470 cm-1 M-1
For 1/100 dilution: A= εCl
0.137=15470 * C * 1
C1= 8.86 * 10-6 M which is equal to 8.86 µM.
For 1/10 dilution: A=εCl
1.169= 15470 * C * 1
C2= 75.6 *10-6 M which is equal to 75.6µM.
The results show that the two dilutions contained different concentration amounts. This is due to the difference in volume of the protein transferred in the two dilutions. In the 1/100 dilution, 1 µl of protein was transferred while in the 1/10 dilution 10 µl of protein was transferred. Considering that these small differences in volumes have a great impact on the results would help us avoid errors and hence improve the accuracy of the results obtained.
SDS-page
From figure 2, the crude lysate for Apache group has several proteins with different molecular weights. The column to the right represents the Damini protein, which has almost other two bands lying between 12 to 15 KDa. The theoretical value for Damini is 14,716 KDa.From this, it can be concluded that the strongest blue color that was obtained in the region of 14-15 KDa represents Damini while the other two bands lying between 12-14 KDa represent impurities in the solution.
The impurities may be because of adsorbance to the affinity matrix while the crude lysate was applied to the column. Subsequently, they were eluted alongside the Damini protein using the elution buffer B.
Size Exclusion
From the results obtained in table 1, there exists a relationship between the values used to calculate Kav and those obtained from calculation of the log 10 of the molecular weights. There is a linear relationship that was tested in appendix 1. The correlation coefficient(r) is equal to -0.98784 thus proving that the relationship is linear. From the Damini chromatogram, a kav of 0.5057 was obtained.On plotting the value in a calibration plot in Appendix 1, Damini had a log (MWT) of 1.5.The molecular weight would thus be calculated as 101.5 giving 31.6 KDa.
Different elution times were obtained from the SDS-page and SEC. It can be concluded that, one protein of the same molecular weight could have a variety of elution times because of the differences in folding. Since SEC can determine the quaternary structure of a protein, the results of 16.24ml may be due to the dimer structure of Damini.The molecular weight was concluded to be 31.6 KDa for the dimer.Thus a monomer would be equal to 15.8 KDa, which is close to the value obtained by SDS-page (14-15 KDa).