Results
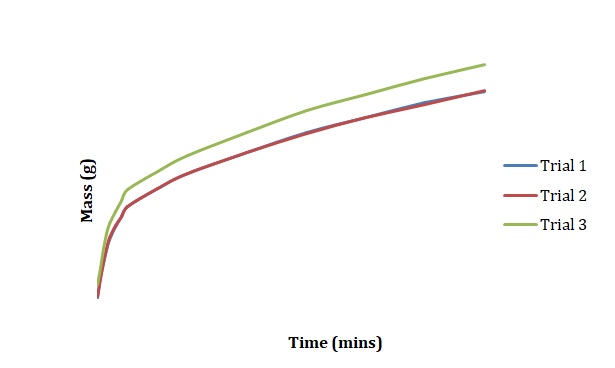
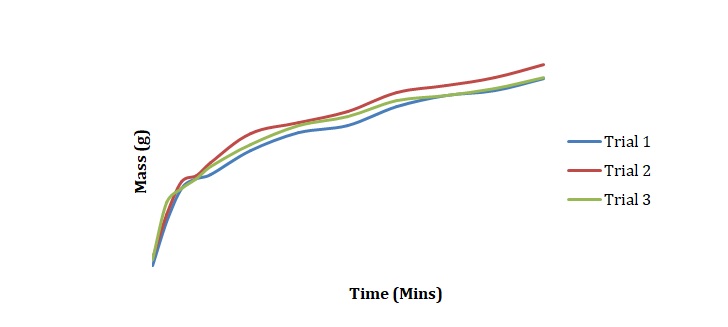
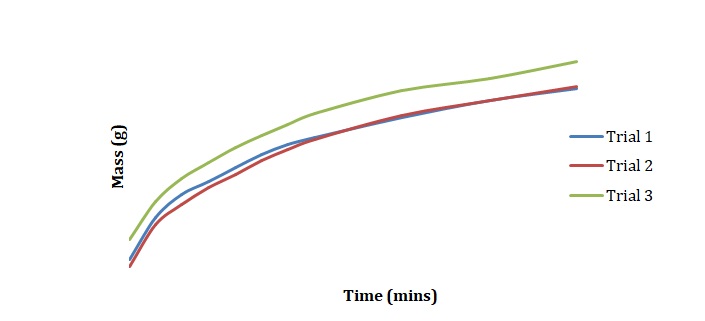
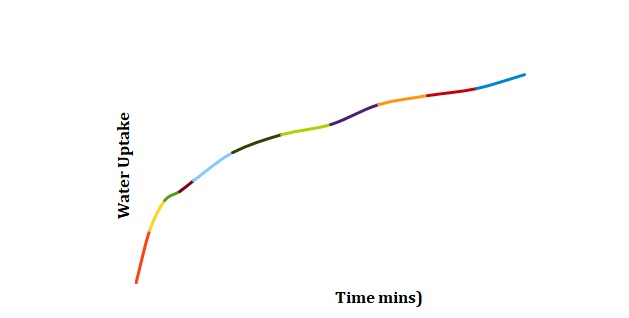
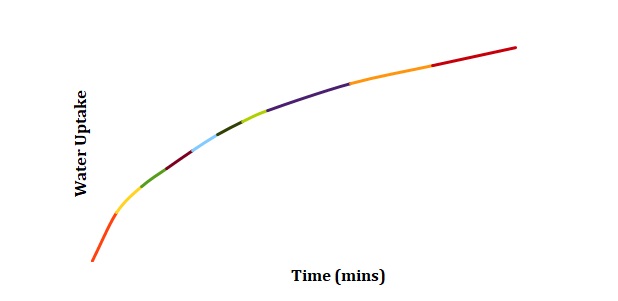
Plots have been created to show how the mass of chickpeas changes with the time of soaking in deionized water (see Figure 1), 2M NaCl (see Figure 2), and 3M NaCl (see Figure 3). These plots were compared for 3 duplicated sets of experimental conditions. It can be seen that differences between duplicate experiments are insignificant which means that the experiment was conducted with little measurement error.
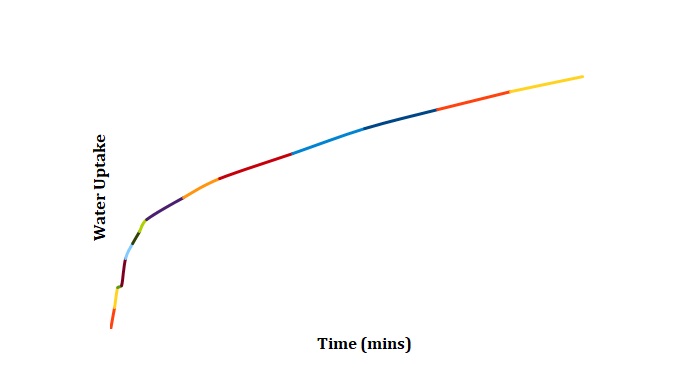
Normalized moisture content has been calculated by dividing the change in mass by the initial starting mass of the sample. Figures 1-3 has been replotted using the chosen normalization method to achieve Figures 4-6. The initial rate of hydration was determined as the slope of Figures 4-6 at short times. It was assumed that a short time is a very little period between t0 and t1. In Figures 4-6, this period is shown as the length of the double arrow. Initial hydration rates (1/k1) for deionized water, 2M NaCl, and 3M NaCl are 0.0885 min-1, 0.0302 min-1, and 0.0239 min-1 respectively. If one kept taking data for a long time, the graph of moisture content would go up until it reached equilibrium.
Physical chemist Peleg (1988) proposed a two parameter model to describe the kinetics of water absorption of chickpeas:
To simplify the equation, it has been assumed that the initial value of moisture content M0 of a dried chickpea equals zero:
At very long times, k2t goes to infinity, and k1 remains relatively small:

The constant k2 is the capacity constant that relates to maximum attainable moisture content. Regions that will be used to determine k2 can be seen in Figures 4-6. In turn, k1 may be determined from the first derivative of the Peleg equation:
The region of graphs that is related to the first derivative is the one where the time is relatively short. Using the above-made assumptions, k1 and k2 have been calculated as slopes of graphs at the minimum and maximum time respectively (see Table 1).
Table 1. Experimental Determination of k1 and k2.
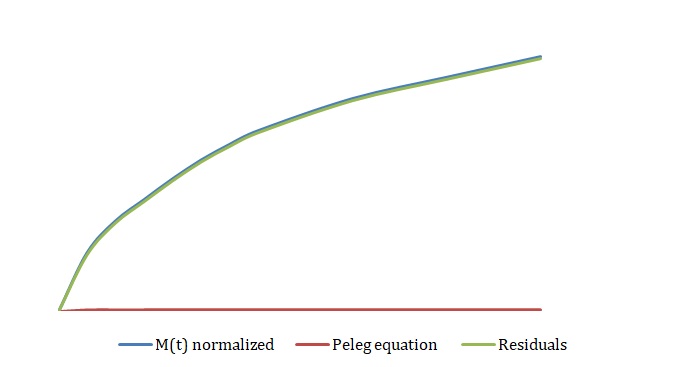
The simplified Peleg equation allows for calculating Peleg constants k1 and k2 using the least squares method that implies the creation of a straight line with the minimum sum of squares of the errors. One should calculate constants using an empirical equation and then use the Solver routine in Excel to generate more appropriate constants with the lowest sum of the squares of the residuals. The non-linear fitting has been used to find the best values of k1 and k2. The optimized values of k1 and k2 and the sum of all residuals have been compared with the constants calculated above (see Tables 2-4). The model equation does not fit the data using initial guesses for k1 and k2 (see Figures 7, 9, 11). After running the Solver routine, the model equation fits the data much better (see Figures 8, 10, 12).
Table 2. Initial Guesses vs. Improved Constants for Deionized Water.
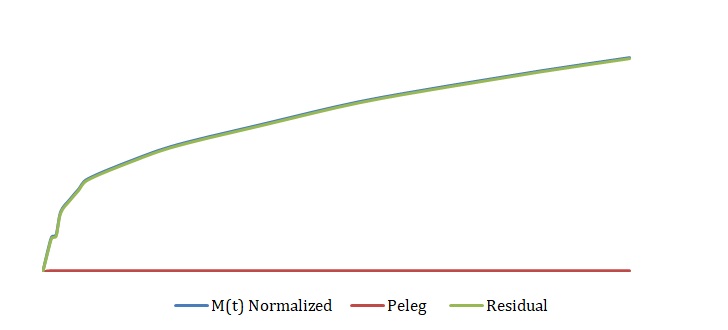
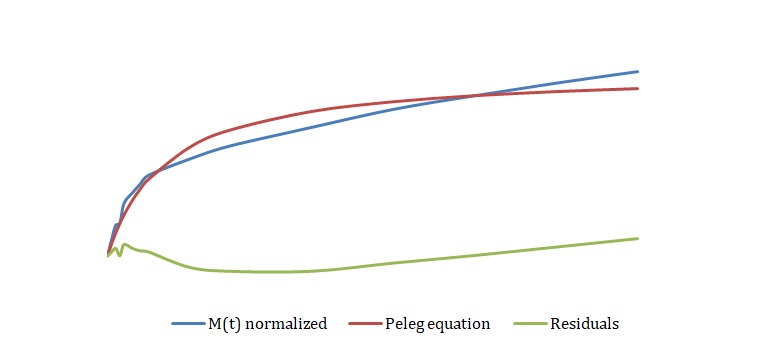
Table 3. Initial Guesses vs. Improved Constants for 2M NaCl.
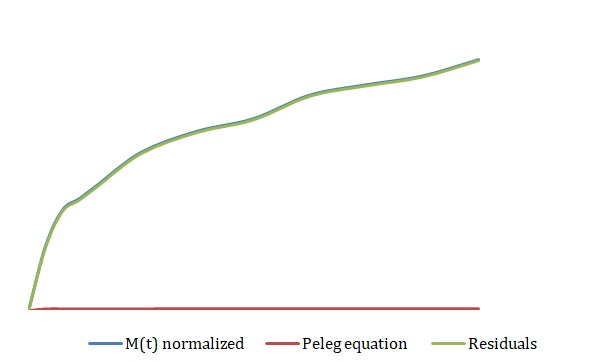
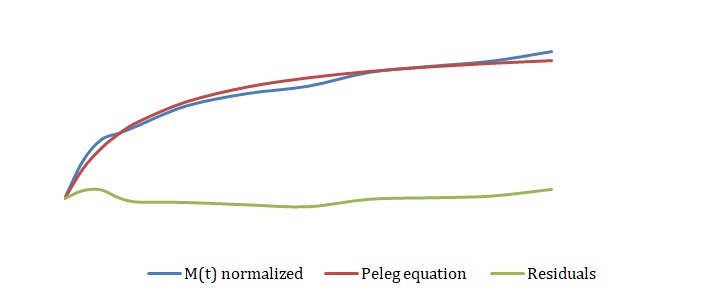
Table 4. Initial Guesses vs. Improved Constants for 3M NaCl.
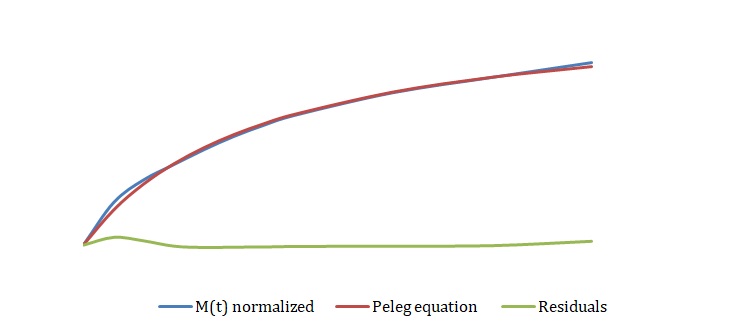
Based on Figures 8, 10, and 12, one can say that the Peleg equation adequately describes experimental data for calculated k1 and k2. However, one could mention that to predict the equilibrium state, the following formula should be used:

This formula, however, cannot be applied to the presented plots as neither of the samples reached equilibrium. In the equilibrium state, moisture content does not change with time.
Discussion
The nature of the water absorption process does not depend on the number of chickpeas. Therefore, curves of mass versus time would not look different if one started with a different number of beans. However, it would be impossible to compare runs that have the same salt concentration for the different number of beans. In such a case, it is necessary to normalize water uptake to compare trials with a different number of beans directly. Apart from a different number of beans, there are no other differences in the physical and chemical process of hydration.
Understanding the nature of osmotic hydration is crucial for discussing experimental data. Chickpea is a semi-permeable membrane that allows certain molecules of solvent to pass through. Osmosis occurs when solvent molecules move from higher to lower concentrations of solute through a semi-permeable membrane (Adamson, 2012). If the solution in the sphere and the solution outside of the sphere have the same salt concentration, no moisture uptake would be observed, and the size of the sphere would be the same.
If the solution in the sphere had a higher salt concentration than the surrounding liquid, the sphere would take water and increase in size (Atkins and Paula, 2014). If the solution in the sphere had a lower salt concentration than the surrounding liquid, the sphere would decrease in size, and solvent molecules present in the sphere would flow into the surrounding liquid. At the beginning of the experiment, the solution was hypotonic, and when a steady-state of water uptake was achieved, the solution became isotonic (see Figures 1-6). Such a trend is consistent with the model of osmosis because the rate of hydration determined for the salt solutions decreases as the concentration increases. This is because the rate of hydrolysis is inversely proportional to the square root of hydration. So when the concentration increases, the degree of hydrolysis decreases thereby decreasing the rate of hydration. When a steady state is achieved, the greatest amount of moisture content is observed for 2M NaCl (see Tables 1-4).
According to the results obtained from the experiment, the best way to make stew from dried beans is to hydrate them with pure water rather than the salt solution. It is also important to ensure that there is approximately 2-3 cm of liquid above the tops of the beans. If there is room temperature, it will take more than one hour before beans are 100% moisturized.
Though empirical, the Peleg model considers general principles of mass transfer in osmotic media and is used to predict kinetics in different systems. A similar thing for all the different systems is that the driving force for mass transfer is the difference in osmotic pressure. However, the Peleg equation is not universal and may be applied to a limited range of temperatures (Yaday and Singh, 2014). This leads to potential experiments that are conducted at different temperatures for different concentrations of different solutions to learn the best temperature and concentration that have the best water gain or loss.
In the given experiment, two different types of models have been used. The first one implies fitting an empirical model or equation to the data. This model is not time-consuming but is unlikely to yield considerably precise results. Another type of model uses non-linear fitting in a spreadsheet program to obtain precise results. Despite the simplicity and applicability of the model, it may be used only if there is a causal relationship between variables. Since there is a causal relationship between time and moisture content, constants calculated using the least-squares method fit the data better than initial guesses (see Figures 7-12).
It is now possible to discuss factors that could affect the time needed for soaking the chickpeas. They may include the chemical composition of the chickpeas, temperature, and the concentration of the osmotic medium. The experiment to test these factors may involve the utilization of the Peleg model to describe water absorption of spring and winter chickpeas between 20 and 1000C. Another experiment may involve the utilization of the Peleg model to study osmotic dehydration in solutions of different concentrations.
References
Adamson, A. A Textbook of Physical Chemistry, 2nd ed.; Elsevier: New York, 2012; pp. 376-380.
Atkins, P.; Paula, J. Atkins’ Physical Chemistry, 10th ed.; Oxford University Press: Oxford, 2014; pp. 199-201.
Peleg, M. An Empirical Model for the Description of Moisture Sorption Curves. J. Food. Sci. 1988, 53, 1216-1219.
Yaday, A. K.; Singh, S. V. Osmotic Dehydration of Fruits and Vegetables: A review. J. Food Sci. Technol. 2014, 51, 1654-1673.