The cooling curves of the pure compounds and various mixtures were used to construct a solid-liquid phase diagram of the biphenyl and naphthalene systems. A phase diagram shows melting, freezing, vaporization, and sublimation. These graphs represent the temperature, pressure, and composition relationships. One of the easiest ways is to use cooling curves to create phase diagrams and determine phase transition temperatures. The melting point of a substance may be determined by measuring the rate at which it cools from a liquid to a solid at a constant atmospheric pressure. Assuming the composition of the samples is known, the rate at which each combination cools may be used to establish the eutectic temperature. Eutectic systems are those in which the melting or solidifying point is lower than the melting point of any one component. The binary phase diagram illustrates the combined cooling curves of the two components to show how each affects the total cooling of the solution.
Each component of the mixture contributes to the solution’s solidification as it cools. At a given time, one of the components will begin to solidify, which may be referred to as compound Y. This slows the cooling process, as seen by the graph’s decreasing slope. Since compound Y is in the solid state, the liquid becomes enriched in compound X, which rises until the eutectic point. A eutectic point will be reached at this moment when both chemicals X and Y have solidified, and the temperature will no longer change.
The cooling of the mixture will continue after the solidification of the mixture has occurred at a pace defined by the heat capacities of the two solids and the composition of the provided mixture. The binary system’s phase diagram may then be mapped using the pure and depressed melting points. From this, the limiting tangent slopes may be used to determine the enthalpy of fusion for each component.
The chemical potential of solid X in a mixture is stated to be the same as pure solid Y at the same temperature and pressure. The following equation (1) can be used to describe the liquid and solid phases of a component’s potential chemical relationship at pressure P and temperature T.
- µ A (s)(T ,P)=µA (l)(T ,P) (1)
The chemical potential relationship of pure solid A and solid A in the mixture can thus be determined using equation (2)
- µ A (s)(T ,P)=µA (l)(T ,P) (2)
Using Raoult’s law, one may determine the chemical potential of a liquid at equilibrium based on its activity. In this experiment, naphthalene and biphenyl mixtures are observed. N-N and B-B interactions (N representing naphthalene and B representing biphenyl) in the liquid phase are assumed analogous to the N-B interactions in the solid phase.
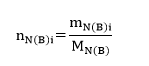 | (3) |
| where n – number of moles, m – mass of the chemical compound, M – molar mass. |
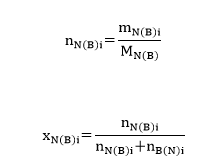 where Xn(b)i– molar fraction of naphthalene (N) or biphenyl (B) in the composition | (4) (5) |
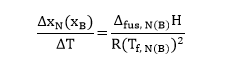 | (6) |
Reagents
- Pure Biphenyl.
- Pure Naphthalene.
Procedure
Wight out 0.001g of nepthalene on wiging paper then transfer it with caution in to a small inner test tube.
Insert a rubber stopper in the sample tube, then put the sample into a beaker filled with boiling water.
Once the sample has dissolved, remove it an dlet it cool down, then insert the prop by remoiving the stopper. The PTFE scpacer should keep the prob centerned.
The tip of the prope should be in the lower third of the melted sample, so not all the way down where it would touch the stirring bar because if it does it would effect the graphing of the sample.
Not complete.
Results
First, the cooling curves for all the nine mixtures were determined, and the results can be found in Figures 1 and 2 (Appendix) for 2 grams of naphthalene + 0.2/0.4(1)/0.4(2)/1 grams of biphenyl and 2 grams of biphenyl + 0.2/0.4(1)/0.4(2) grams of naphthalene accordingly.
Based on these graphs, the final solidification temperatures (freezing points) were identified and documented in Table 1.
Table 1. Determining Freezing Points for Various Mixtures.
Next, to determine the mole fraction for both biphenyl and naphthalene solutions, it is necessary first to calculate the number of moles of each component in different samples using equation #3. Therefore, the sample estimation for the first sample (pure naphthalene) is as follows:
The results for other samples can be seen in Table 2. Note that the molar mass for naphthalene and biphenyl was estimated using formula #4. Thus, as the former reagent consists of 10 carbons and 8 hydrogens, the molar mass equals 128.1705. On the other hand, the latter reagent consists of 12 carbons and 10 hydrogens, and therefore, its molecular weight is 154.2078.
Now, it is possible to determine the mole fraction of naphthalene and biphenyl using equation #5. The mole fraction of the former organic compound for sample #2 is calculated as:
Similarly, the mole fractions of both components were calculated, and the results can be found in Table 2.
Table 2. Sample Molar Composition and Mole Fraction.
Based on the received mole fraction rate and temperature values, it is possible to construct a phase diagram and identify the measured eutectic point. The latter indicates the lowest melting point among all the studied mixtures and equals 41°C against xN =0.37 which can be observed in Figure 3(1).

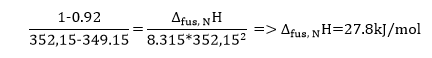
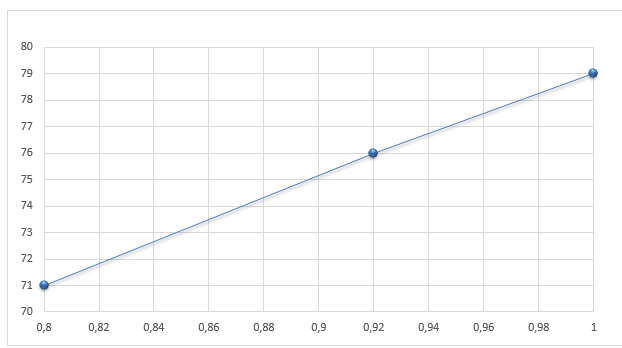
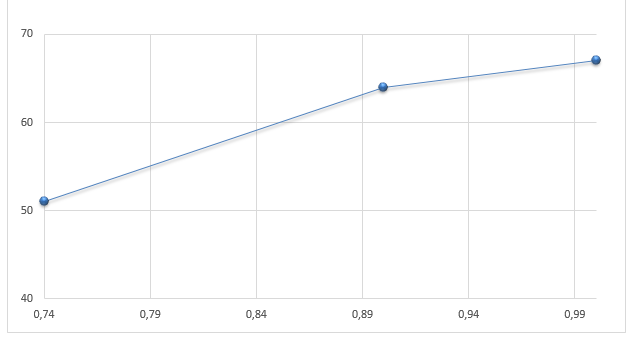
Next, the values of depreciated freezing points are graphically presented against the molar fraction of naphthalene and biphenyl in Figures 4 and 5, respectively. Then, from the limiting tangent where xN(xB)–>1, it is possible to calculate the heat of fusion Δfus, A(B)H assuming that it corresponds to the reciprocal of ΔxN(xB)/ ΔT in equation #6. Therefore, the sample calculation for the naphthalene heat of fusion will have the following form (note that ΔT was estimated in kelvins):
In a similar manner, Δfus, BH was determined to be equal to 31.1kJ/mol.
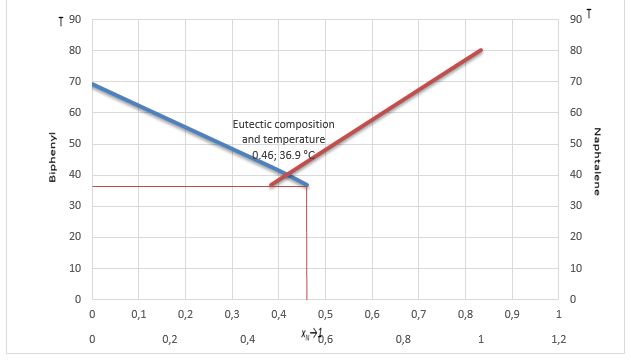
Finally, the eutectic temperature and composition were determined by plotting the ideal solubility curves T versus xN→1. As a result, the new eutectic temperature equals 36.9, and the proportion of naphthalene against biphenyl – 0.46%.
Conclusion
This experiment determined how the melting point of the naphthalene-biphenyl system changed according to the composition of the solution. As expected, the freezing point of pure naphthalene and biphenyl gradually reduced when mixed with the second compound. For instance, the melting point of pure naphthalene was 79 °C, but when the 0.6 (0.2+0.4(1)) grams of biphenyl were added, the final solidification temperature was equal to 71°C. Yet, such temperature reduction persisted only until a certain threshold – eutectic point – was reached, which is the lowest melting point for the naphthalene-biphenyl binary system. As such, it was found that eutectic temperature is equal to 41°C while eutectic composition includes 37% of naphthalene and 63% of biphenyl.
Hence, it is necessary to compare the values received during this experiment with those generally accepted in the literature. According to previous research conducted by the National Institute of Standard and Technology (2021a, 2021b), the melting points of pure biphenyl and naphthalene are 69°C (67°C in this study) and 80°C. Additionally, Hua et al. (2010) determined that the eutectic temperature is 41°C while the composition of naphthalene to biphenyl is 40% against 60%, respectively. Contrary, the ideal solubility curves with a eutectic temperature equal to 36.9°C and 46% of naphthalene percent in the composition. Therefore, it can be concluded that the findings of this study are very close to those of previous research, but differ from the ideal eutectic point, although not greatly.
Finally, the heat of fusion was calculated for both compounds, where the Δfus, NH=27.8kj/mol and Δfus, BH=31.2kj/mol. However, these results were different from the ones obtained by previous studies. In this regard, previous findings suggest that Δfus, NH has varying values from 16.44*kj/mol to 19.25*kj/mol (National Institute of Standard and Technology, 2021b). On the other hand, Δfus, BH equals the number in the range from 18.57*kj/mol to 19.7*kj/mol (National Institute of Standard and Technology, 2021a). Therefore, it can be concluded that there is a significant difference between the results obtained during this study and the ones found in the previous literature.
References
Hua, D., Hong, J., Hu, X., Hong, Y., & Li, J. (2010). Solid–liquid–gas equilibrium of the naphthalene–biphenyl–CO2 system: Measurement and modeling. Fluid Phase Equilibria, 299(1), 109-115.
National Institute of Standard and Technology. (2021a). Biphenyl. Web.
National Institute of Standard and Technology. (2021b). Naphthalene. Web.
(n.d.). Solid-Liquid Equilibrium in a Binary System.