Modern economic theory, both at the micro and the macro level, ever more complex economic processes have led to the need to create and improve unique methods of study and analysis. At the same time, the use of modeling and quantitative analysis has become widespread. Based on the latter, one of the areas of economic research, econometrics, emerged and developed for the purpose of in-depth analytics of financial indicators. Econometric models and methods are now a powerful toolkit for obtaining new knowledge in economics and a widely used apparatus for making practical decisions in forecasting, banking, and business (Asteriou & Hall, 2015).
The development of information technologies and special applications, and the improvement of methods of analysis have made econometrics a powerful tool for economic research. Often, in economic matters, they resort to mathematical models and systemic and statistical analysis.
Polynomial regression is a type of regression analysis in which the independent and dependent variables are represented as a polynomial of a certain degree. As a rule, the order ranges from the second degree, which is a special case of quadratic regression in the form of a parabola, to the sixth degree. The conditional mean of the dependent variable is most often nonlinearly dependent on the independent variable. The end function is linear, even though the data model itself is not. Multiple linear regression is also a special case of polynomials, due to the fact that the degree of the base variables increases (Ostertagová, 2012). Classification tuning and least squares are most commonly used to fit a model of this kind of regression. This method is one of the fundamentals in statistics and is often used in econometrics to predict various financial indicators.
Polynomial regression can be applied in mathematical statistics when modeling trend components of time series. A time series is essentially a series of numbers that depend on time. In this case, these are the years over which Amazon’s financial performance is measured. Among these indicators are sales and the ratio of net profit and loss. Amazon is an American organization, one of the largest globally among companies that sell all kinds of goods and services over the Internet. It is also a leader in the field of sales of consumer goods through the system of Internet services (Smith & Linden, 2017). At the moment, the company is the leader in its market, and its founder is in the ranking of the wealthiest people in the world.
The polynomial function is used in cases when it is impossible to describe the function sought for by certain indicators linearly or quadratically. The need for use is determined by the number of extremum points, as well as the complexity of the trend line drawn from the points. A higher degree of the full function better describes the initial data but loses the properties of predictability and generalization. The purpose of building a polynomial regression model in the field of time series is forecasting.
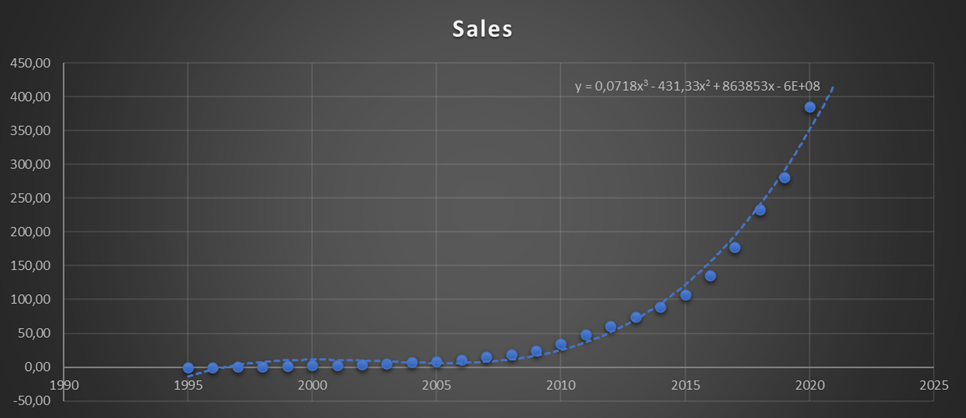
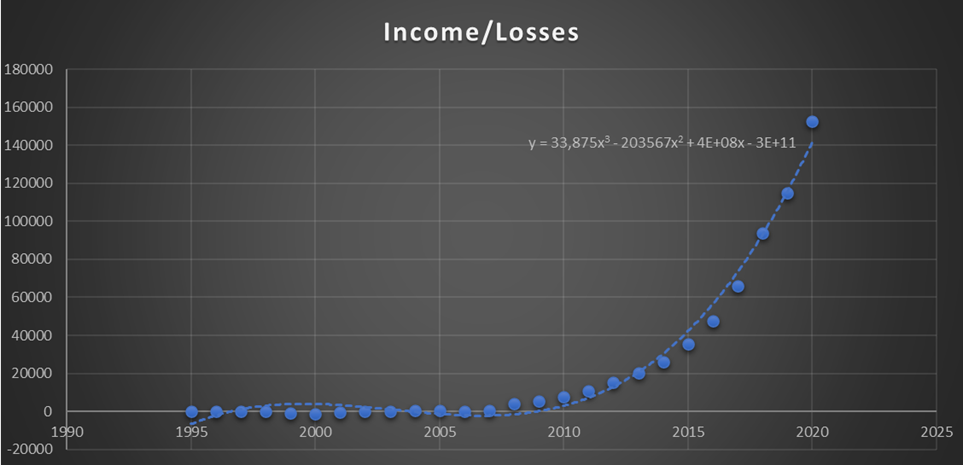
Linear regression, in this case, is insufficient since the trend line does not take into account the relief dynamics on the chart, when, for example, in the difference between losses and profits, the chart goes into negative territory. It is possible to complicate the function to quadratic if the trend line is similar to a parabola and is closest to the specified data. However, a polynomial regression with a degree of 3 will be applied in this case since this trend line best matches the indicated data on the scatter plot. The information for charting is taken from the Macrotrends website, which contains the current financial indicators of the largest companies (2021). The graphs are shown in Figures 1-2.
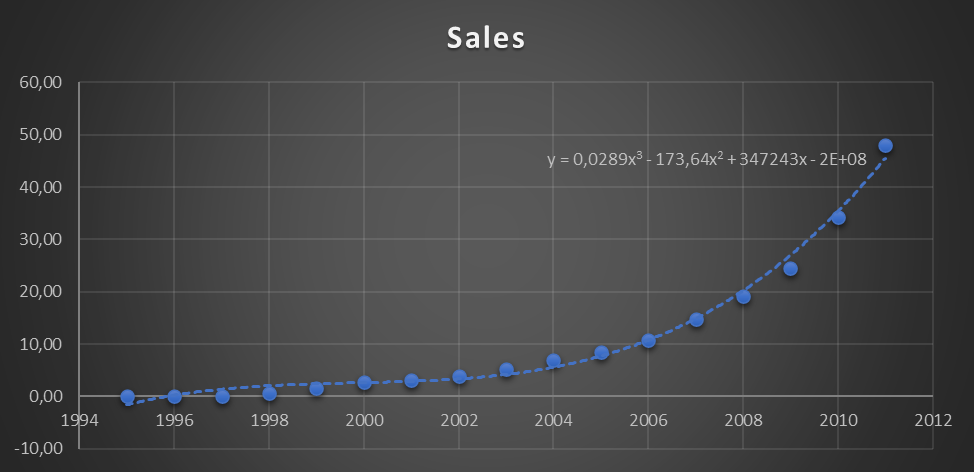
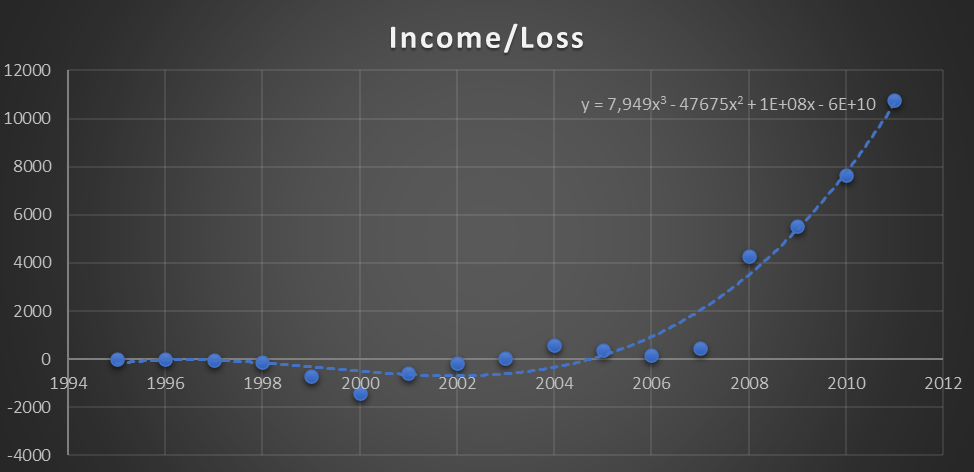
The process of defining the polynomial model was as follows. If the number of extreme points on the Income / Loss scatters plot is determined, it will be seen that there are at least two of them before the function goes up. There is only one extreme point on the sales chart; however, in comparison with the complete second and third degrees, they show different results, within which the third is more accurate.
Such improvements are not observed with a similar comparison of the third and fourth-order polynomials. A polynomial of the third degree can have only one or two extremum points. Therefore, the definition was correct. Higher exponents of the polynomial model degrade the prediction function and only perform well on the original dataset. In practice, it is not recommended to make the degree of the approximating polynomial higher than the fourth – sixth since the errors of the regression implementation significantly increase.
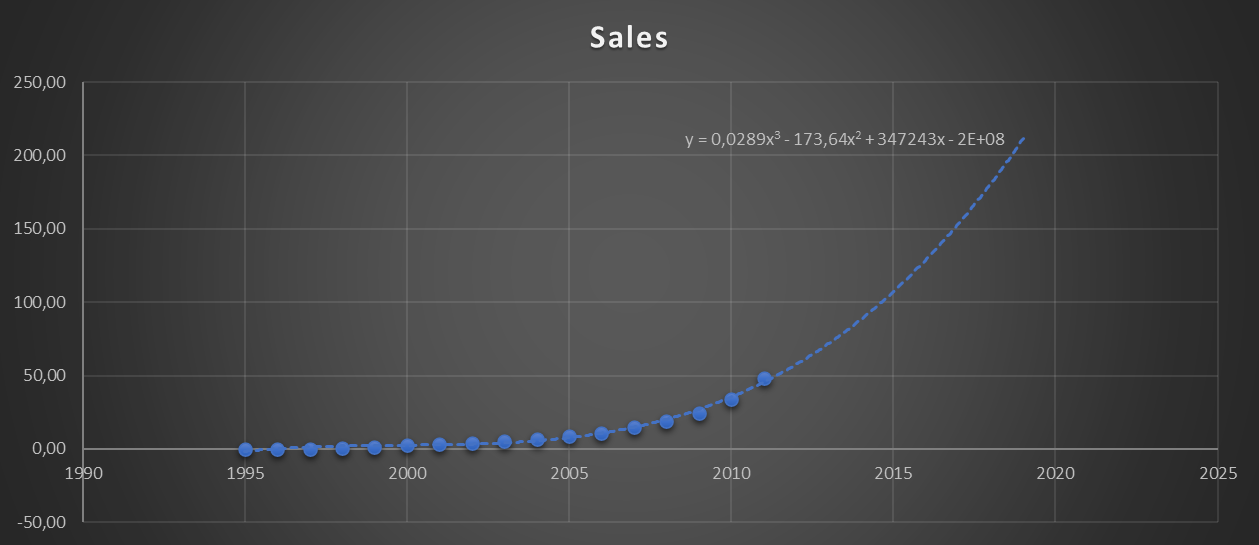
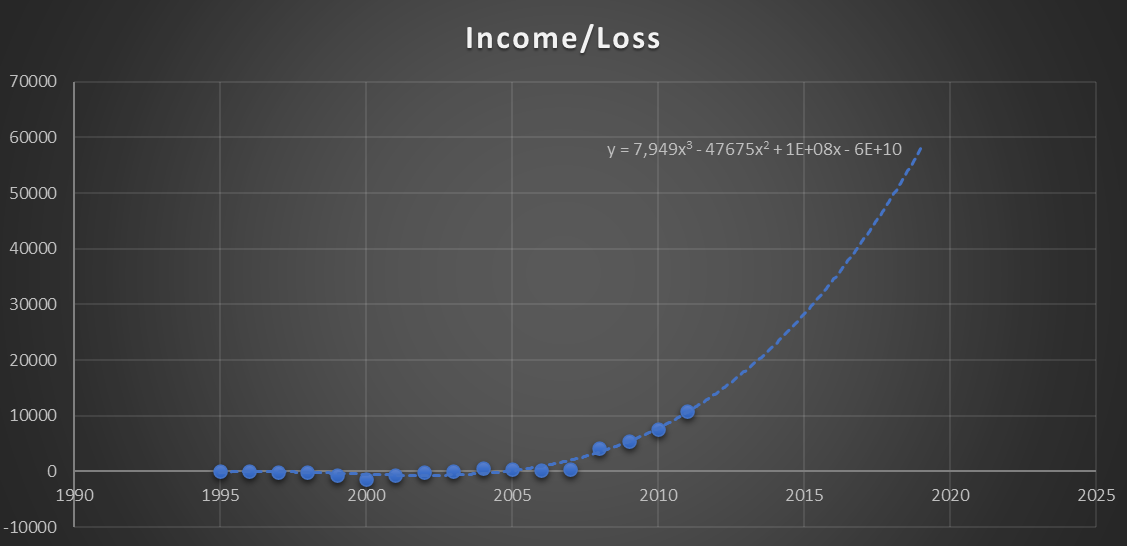
How adequately and well defined the model data and equations can be shown by the prediction function. The absence of outliers and their handling, scaling, and transformation functions of the model can confirm its robustness. If the continuing trend line for the coming years coincides with the company’s actual growth, the model can be considered valid. Below are charts with an extended trend line for both financial indicators of the company. The graphs are shown in Figures 3-4.
Below are the charts that have been compiled from sales data and loss-to-earnings ratios up to 2020. The information was also taken from the resource Macrotrends (2021). In general, these functions almost correspond to the forecast based on polynomial regression, although the function describing the new trendline is significantly different from the previous one. The graphs are shown in Figures 5-6.
Polynomial regression describes Amazon’s chosen metrics reasonably well. The forecasting function has been tested and compared with similar indicators for 2015-2020, which are already in the public domain. The direction of the trend line is indicated correctly; however, in the forecast, the indicators are slightly underestimated relative to the real ones. Nevertheless, the function starts tending to infinity, and the company’s financial indicators are going uphill, which means stable growth without additional emergence of extremum points. If new extreme points are not inclined to appear both in the forecast and in reality, this model can be successfully used further without increasing the order, making a discount for a certain amount of inaccuracy downward. For a more detailed assessment of the company, it is necessary to analyze other financial indicators that take into account taxes, assets, liabilities, shares, and various kinds of margins.
References
Asteriou, D., & Hall, S. G. (2015). Applied econometrics. Macmillan International Higher Education.
Macrotrends. (2021). Amazon – 24-Year Stock Price History | AMZN. Web.
Ostertagová, E. (2012). Modeling using polynomial regression. Procedia Engineering, 48, 500-506.
Smith, B., & Linden, G. (2017). Two decades of recommender systems at Amazon. IEEE Internet Computing, 21(3), 12-18.