
Background
Conducting statistical analysis aims to inform decisions that minimize bias and the potential for systematic error. This project investigates pigeon behavior using continuous bird movement data (Gagliardo, 2020). Data from a GPS tracker physically attached to the pigeon was used for analysis—statistical analysis involved plotting and detailed examination of data describing the bird’s movement.
Data Visualization
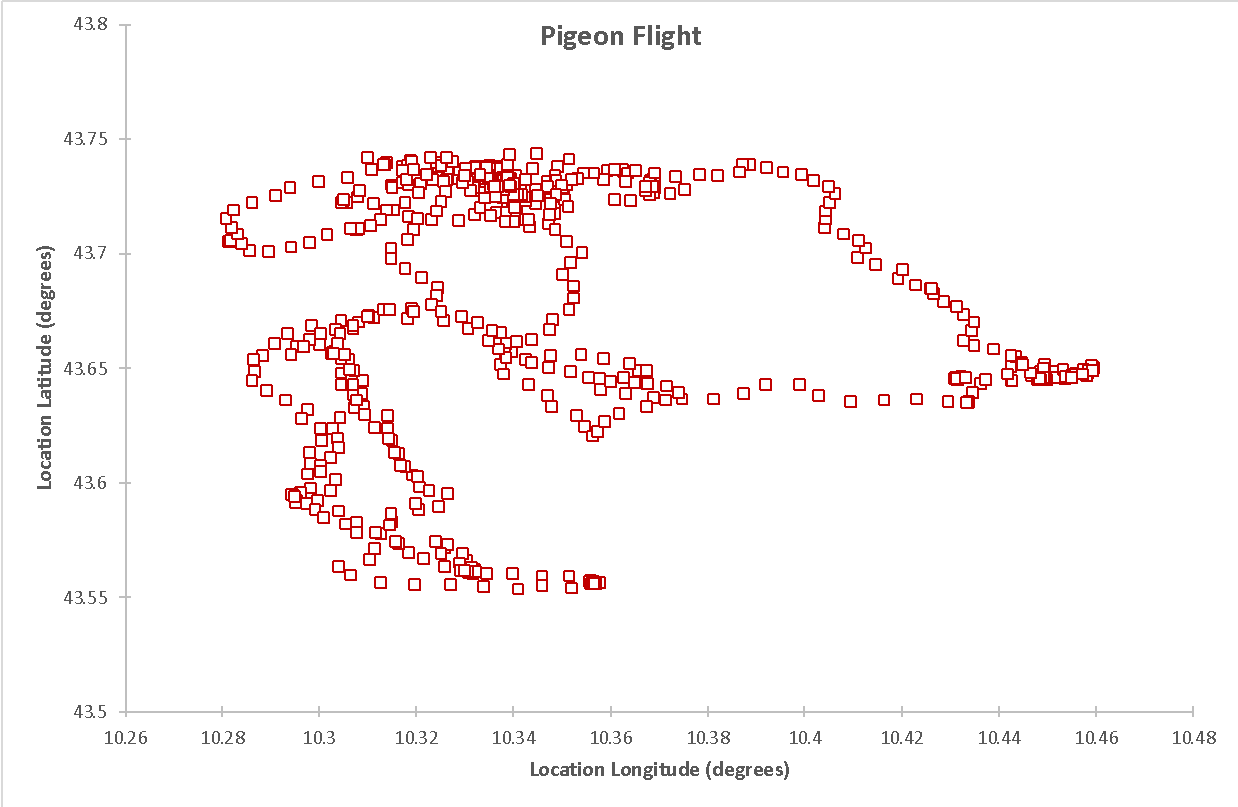
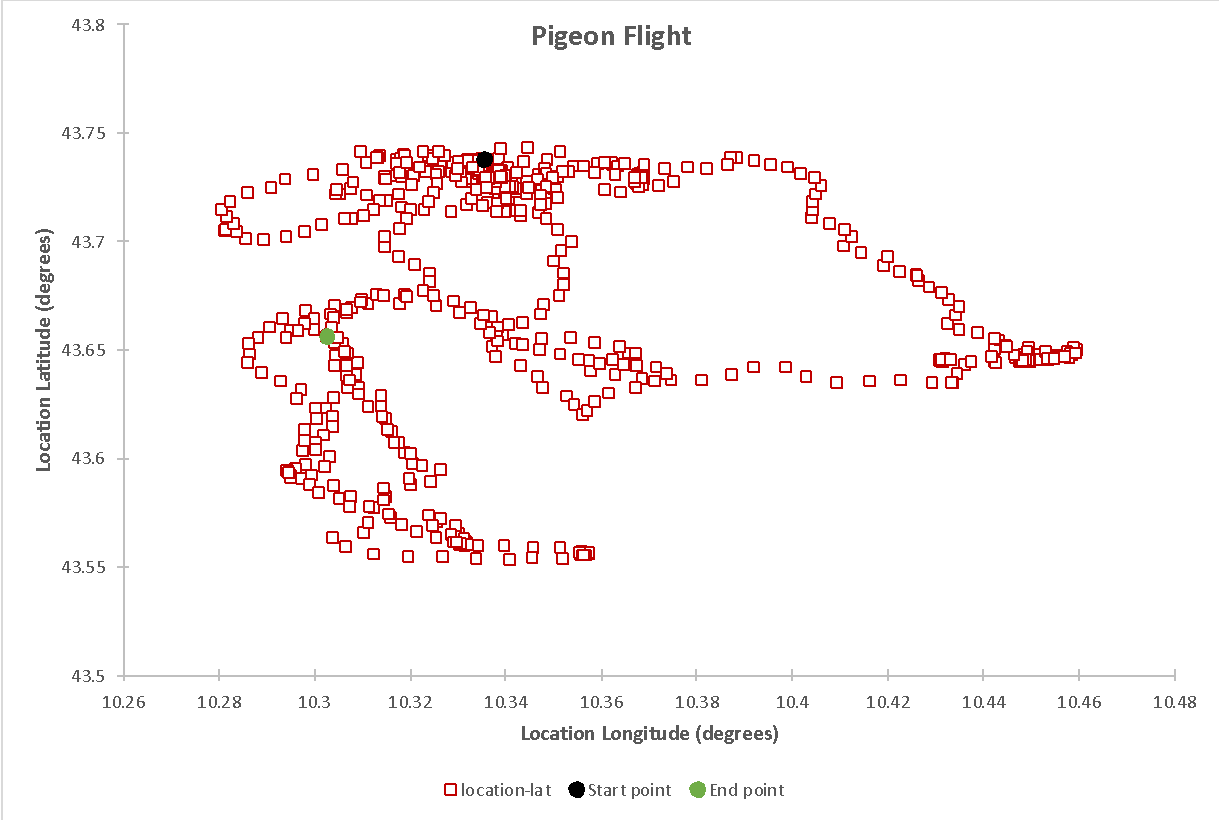
Figure 1 shows a scatter plot for the longitude and width coordinates of the bird: this diagram shows the movement of the bird in two-dimensional space. The data suggest the movement showed no apparent patterns or regularities and was mainly stochastic. Figure 2 contains the same data, with the start (black) and end (green) points indicated.
Data Analysis
Distance
One analysis of the collected data is determining the total distance the pigeon flew during the observation. On the one hand, latitude defines the horizontal lines that divide the planet into sectors. Zero latitude refers to the equator line, and all subsequent lines are in 10° increments. From the equator toward the north, latitude increases, so the north pole has a maximum latitude of +90°. On the contrary, south of the equator, towards the South Pole, latitude decreases, and the South Pole has a latitude equal to -90°.
On the other hand, longitude defines the vertical curves that connect the western and eastern hemispheres of the planet: zero longitude passes through Greenwich, England, and subsequent lines are spaced at 10° increments. To the left of Greenwich (in the two-dimensional projection of the planet), longitude goes into negative values, whereas towards the east, longitude has the property of rising.
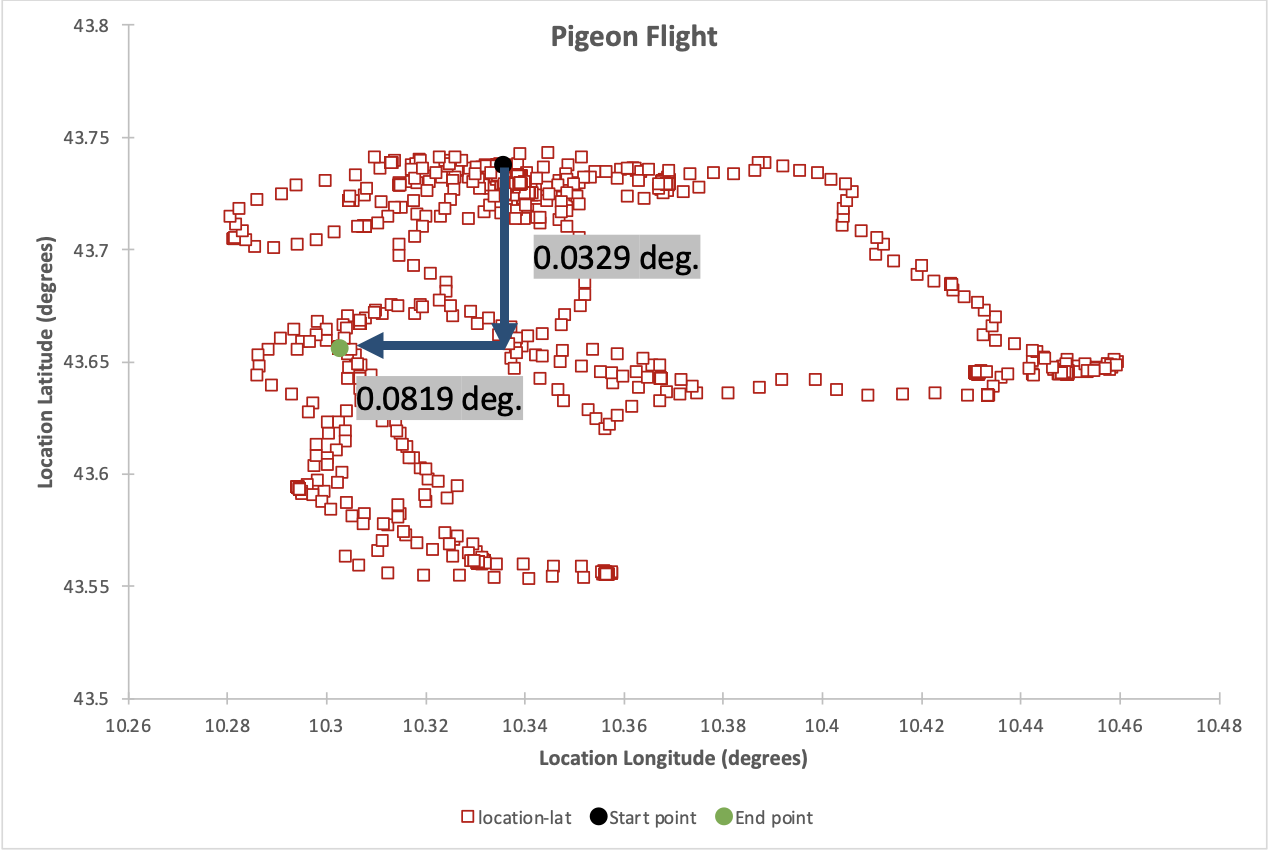
This implies that, in terms of the absolute distance the bird flew from north to south, it is 0.0329 degrees, calculated as the final latitude (10.3028) minus the initial latitude (10.3356), with the absolute value taken. In terms of the absolute value of the bird’s flight direction, the figure was 0.0819 degrees; this value was obtained by subtracting the initial latitude (43.7383) from the final latitude (43.6564) and then taking the absolute value. Thus, the absolute movement of the bird was 0.0329 degrees from north to south and 0.0819 degrees from east to west. A more detailed illustration of this movement is shown in Figure 3.
Speed
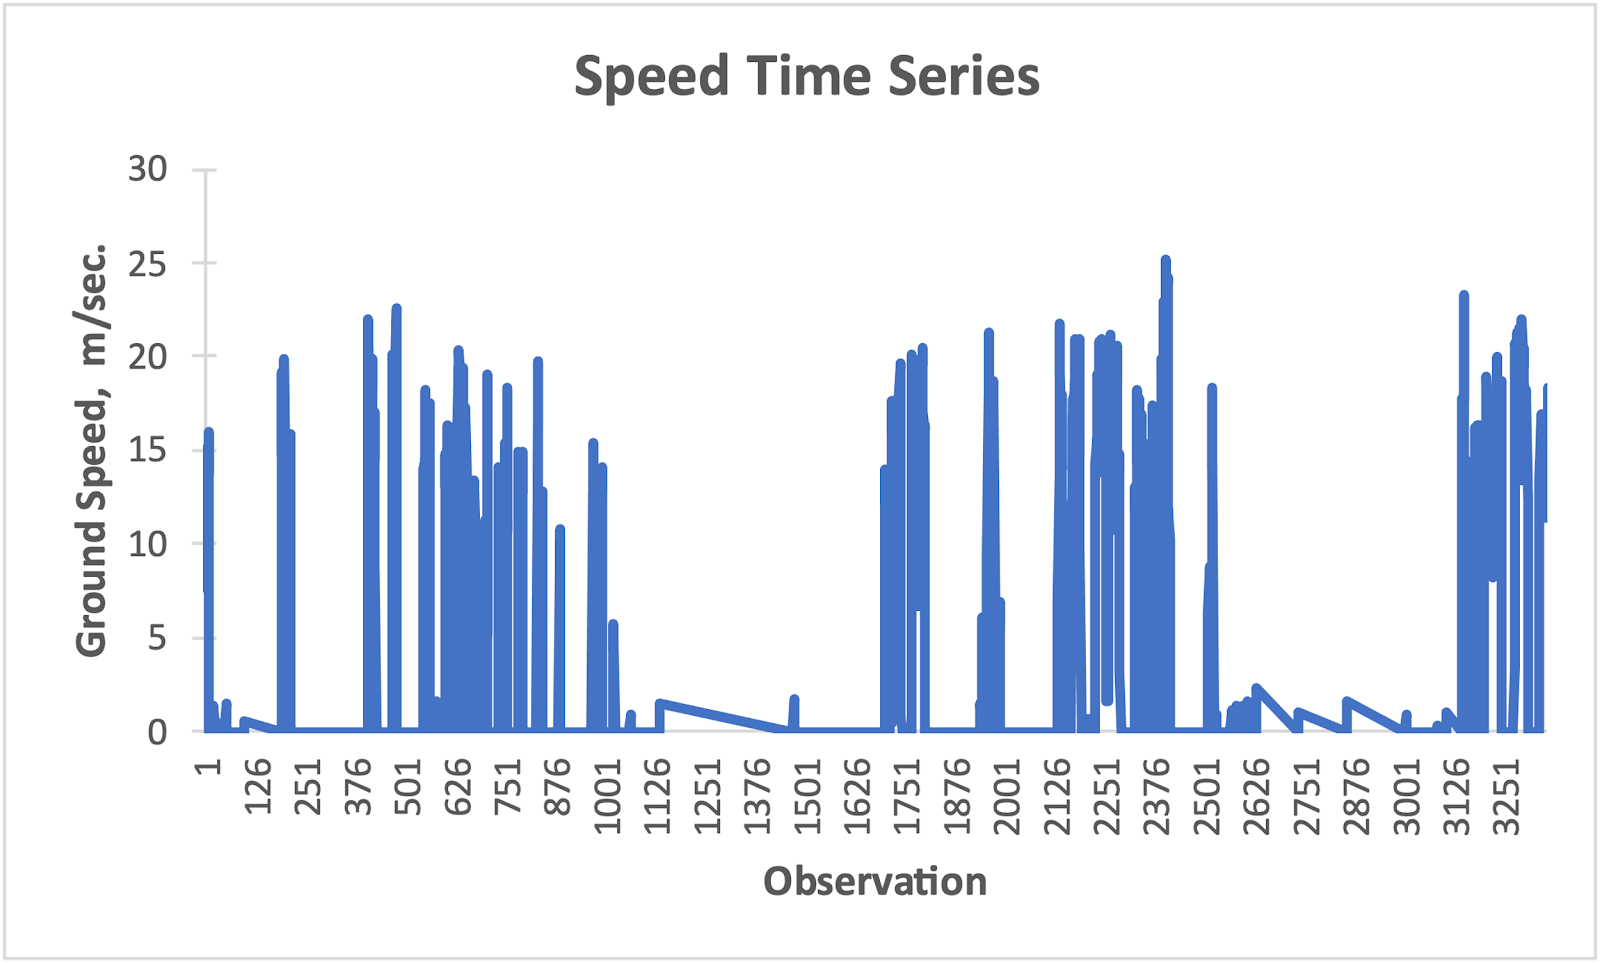
Another analysis option for the collected data is to examine the bird’s speed over time. Figure 4 is a time series of bird speed throughout the observation period: as shown, birds increased and decreased speed and made stops. The maximum speed of the bird (highest peak) was 25.16 m/s, while the minimum speed was 0 m/s, corresponding to a stop in flight.
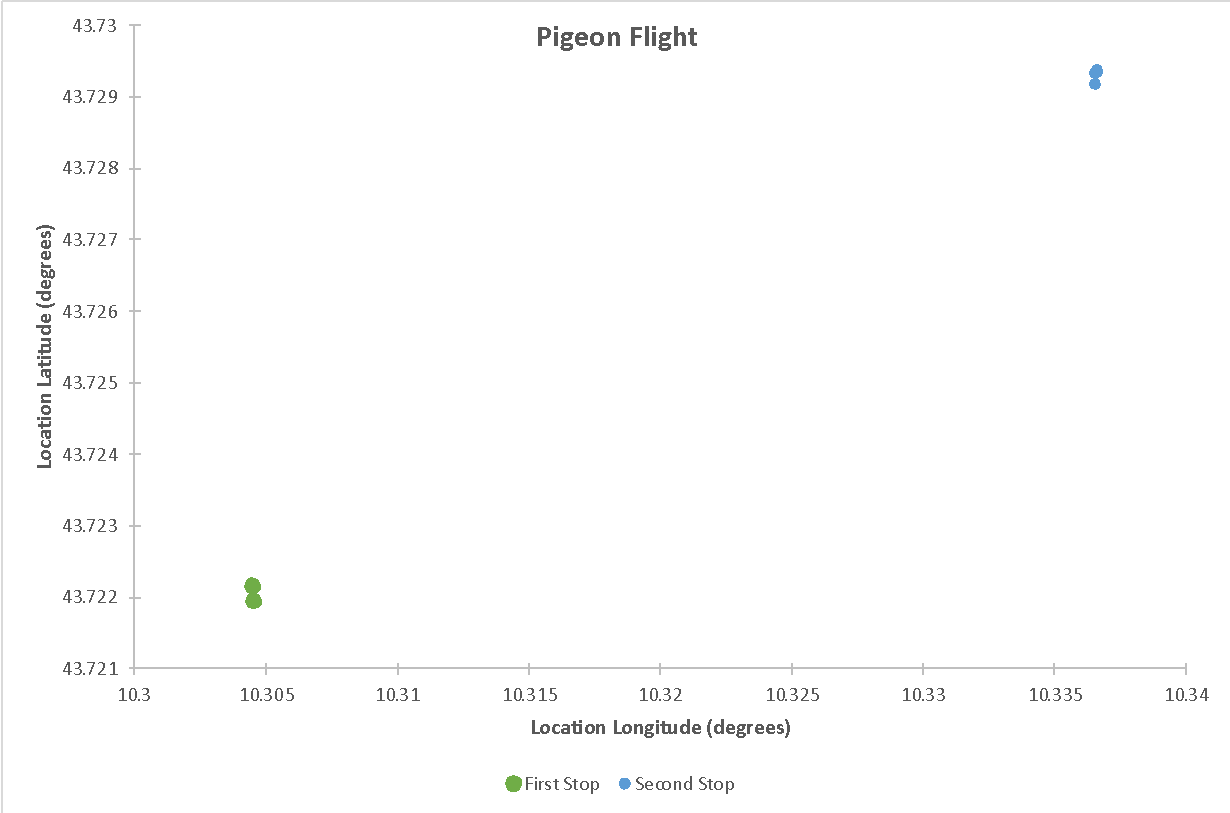
The large horizontal lines at zero velocity correspond to the long stop the bird was making. The time series shows that the most extended pauses occurred between time points 251 and 376 and 1501 and 1626; at both stops, the bird spent 125 time units (seconds or minutes). As shown in Figure 5, the bird’s first stop was south and west, followed by its second stop, north and east.
Reference
Gagliardo, A., Pollonara, E., & Wikelski, M. (2020). Pigeons remember visual landmarks after one release and rely upon them more if they are anosmic. Animal Behaviour, 166, 85-94.