Introduction
Displaying statistical materials as one of the convenient reporting methods is a common practice in various fields. In the sphere of homeland security, graphic charts and diagrams are often utilized to demonstrate the level of the violations of state borders, crime rates, and other crucial data. Nevertheless, even in such reports, it is possible to come across some fallacies or misrepresentations caused by different factors – the desire to increase the effect on readers, incorrectly chosen assessment tools, or false facts. On the example of the article “Trump Wall – All You Need to Know About US Border in Seven Charts” by Rodgers and Bailey (2019), some cases of statistical errors will be considered. In general, this work is relevant in the context of the current problem of immigration to the USA from southern countries, but visual reflection methods used in it contain incomplete and insufficiently substantiated information.
Using a Truncated Scale
The report in question provides information on the rates of migration and, in particular, apprehensions committed on the US-Mexico border. As evidence, Rodgers and Bailey (2019) cite statistics and compare arrest rates during the reign of three presidents in the period of 2000-2019. Figure 1 shows graphic information where all the variables are included, and according to these data, the level of apprehensions has decreased.
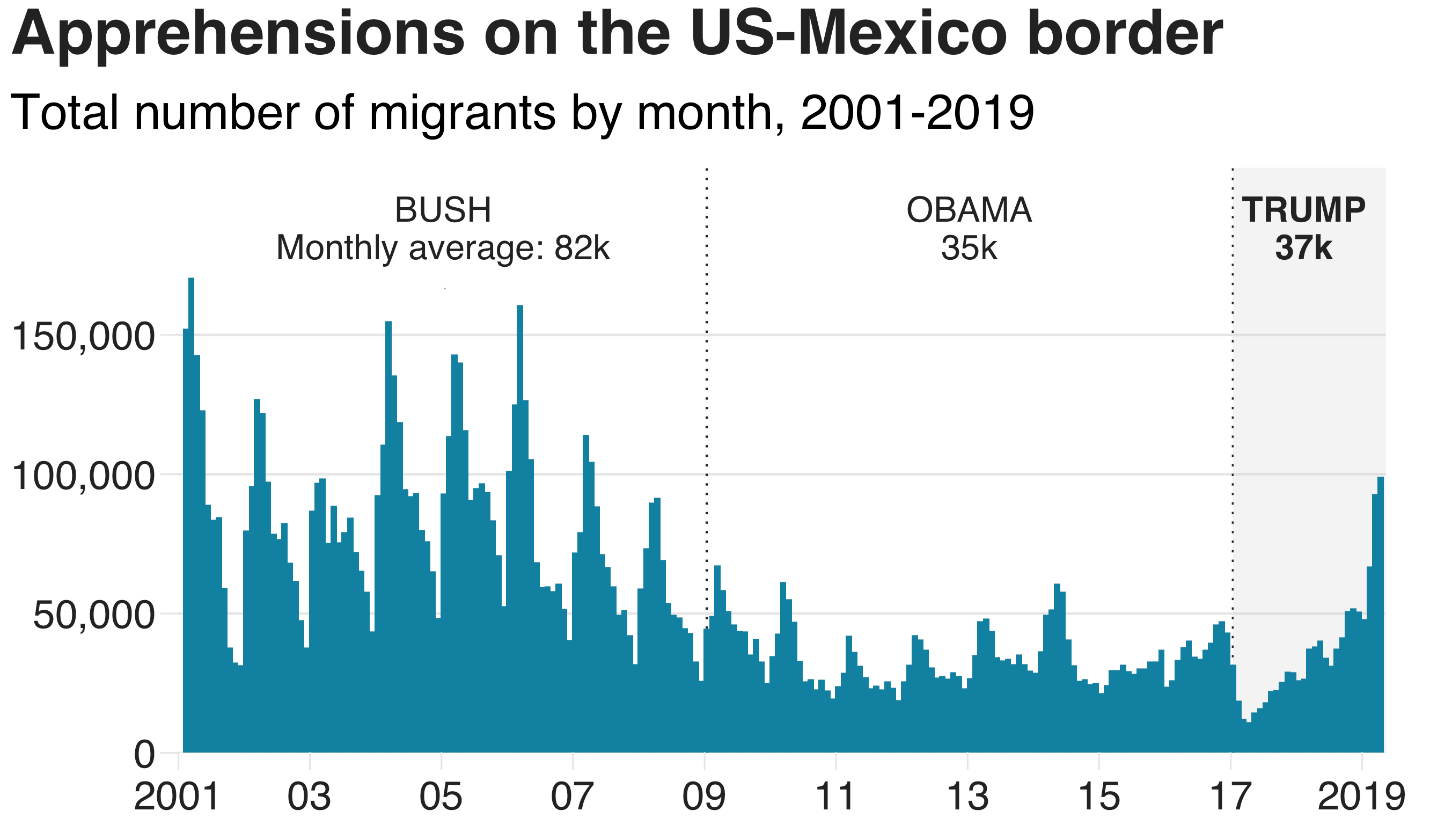
Nevertheless, when evaluating these statistics from the standpoint of reasonableness, it is logical to doubt their accuracy. There is a notion of a truncated scale that is unfair with respect to the presented histogram due to insufficiently detailed facts (“Display of statistical data,” n.d.). For instance, the used gradation does not allow understanding how exactly the number of apprehensions differs in certain periods, which is a significant limitation of such a chart. It is impossible to estimate difference parameters, and only approximate information is available. This, in turn, makes such a statistical result incredible and even biased, which is particularly unacceptable in the reports of national importance since these figures may be applied in the official documentation. Therefore, a truncated scale is not allowed to display the presented outcomes.
Incorrect Display
Migration policy problems are discussed in various academic papers due to the importance of this topic in the modern period of urbanization and overpopulation. Philbin, Flake, Hatzenbuehler, and Hirsch (2018) conduct a study on this issue and mention the legislation governing US migration processes and setting certain limits. In particular, in Figure 2, the authors demonstrate the correlation of laws enacted from 2005 to 2015.
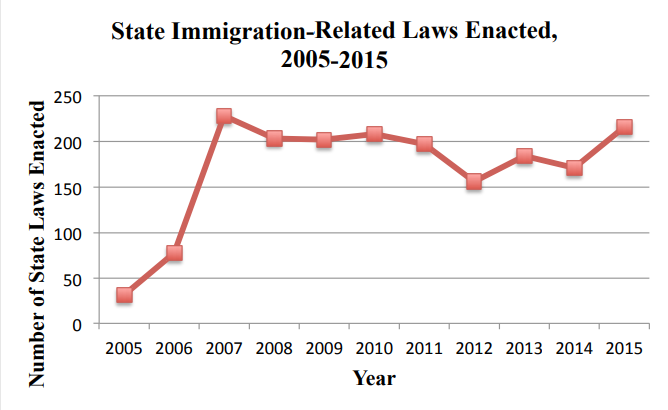
This type of material presentation is convenient and pleasant for perception. However, when evaluating the affected problem, it is worth noting that there is too much discrepancy in the scale of the schedule, in particular, the number of adopted laws. If stakeholders consider such a chart in the context of general information, then the situation will clear. Nevertheless, in the context of official reporting, this mode of displaying is unacceptable since it may entail misinterpretation. If the information of such a statistical aid is used as an appropriate rationale, it will be impossible to obtain accurate information regarding the number of legislative acts. Discrepancies in such issues are unacceptable, and as a recommendation, date tables should be utilized because they carry more fair and precise displays (“Display of statistical data,” n.d.). Therefore, the considered example can also be called partially erroneous.
Atomistic Fallacy
Any statistical presentation of materials may be used in different areas and for displaying various types of information. In addition to the results that provide for large-scale studies, some researchers often resort to the compilation of graphs and charts in order to substantiate rather narrow topics. One of the examples of such visualization is presented in Figure 3, where the authors demonstrate the level of migration to the US from Lithuania.
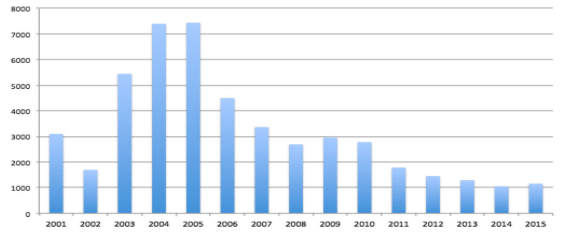
The presented histogram is a rather convenient tool in order to display the necessary information. However, when considering the issue of migration as a whole, such a visual aid may not be fair enough in the context of its global importance. Bijak, Courgeau, Franck, & Silverman (2018) offer to pay attention to the concept of an atomistic fallacy that implies concentrating too much on one particular topic and ignoring the problem of a wider scale. If a certain phenomenon is evaluated from the global position, utilizing such a graph is not of significant importance. Therefore, erroneous data interpretation may occur due to the lack of understanding of the whole issue.
Conclusion
Despite the convenience of visualizing statistical data in the considered article and some other works, some inaccurate or insufficiently substantiated data are presented in them, which is caused by problems with choosing appropriate display mechanisms. Using a truncated scale, incorrect data reflection and an atomistic fallacy are the key issues affected. Utilizing relevant and detailed statistical mechanisms may allow systematizing information and making it reasonable enough to rely on as justification.
References
Bijak, J., Courgeau, D., Franck, R., & Silverman E. (2018). Modeling in demography: From statistics to simulations. In E. Silverman (Ed.), Methodological investigations in agent-based modelling: With applications for the social sciences (pp. 167-187). Cham, Switzerland: Springer.
Display of statistical data. (n.d.). Web.
Philbin, M. M., Flake, M., Hatzenbuehler, M. L., & Hirsch, J. S. (2018). State-level immigration and immigrant-focused policies as drivers of Latino health disparities in the United States. Social Science & Medicine, 199, 29-38. Web.
Rodgers, L., & Bailey, D. (2019). Trump wall – All you need to know about US border in seven charts. BBC News.
Šimelytė, A., Korsakienė, R., & Ščeulovs, D. (2017). Americanization in Lithuania as a driving force for globalization. Journal of Open Innovation: Technology, Market, and Complexity, 3(3), 16. Web.